1. Specifications
Kingston's Data Center 400 (DC400) SSD is the storage device we have in our labs today. This is the latest solid-state drive to join the family of Kingston's entry-level enterprise solutions, designed for read-intensive applications such as boot, web servers and lower data rate operational databases and analytics - especially in data center mixed workload environments where endurance and reliability are important.
The SSD uses an on-board DRAM acceleration cache to enable sustained IOPS to increase performance over a wide range of read/write workloads. The DC400 is based on 15nm MLC NAND and the quad-core Phison S10 controller. It is available in 400GB, 480GB, 800GB, 960GB, 1.6TB and 1.8TB capacities. The 400GB, 800GB and 1.6TB capacities are performance optimized with greater IOPs for faster application performance and reduced storage latency. The 1.8TB capacity read-intensive optimized model is factory-tuned for read-intensive workloads. This optimization is attributed to the amount of the NAND that is allocated to the overprovisioned area. The 960GB version we have in or hands today further allows us to set the amount of reserved NAND that will be used for overprovisioning through the software bundled with the drive, as we will see later on.
Additionally, DC400 SSD features reliability with end-to-end data path protection, SmartECC, SmartRefresh and firmware controlled power loss management. ("pFAIL").
Smart ECC is a RAID ECC technology used to recover uncorrectable errors. When a page is found faulty and flash ECC protection fails to recover the uncorrectable errors, the defective page will be reconstructed by the Smart ECC engine.
The DC400 is backed by a five-year limited warranty. Endurance for the DC400 SSD varies by capacity, with the 400GB rated for 422TB (0.57 DWPD), the 480GB rated for 257TB (0.30 DWPD), the 800GB rated for 860TB (0.58 DWPD), the 960GB rated for 564TB (0.32 DWPD), the 1.6TB rated for 1678TB (0.57 DWPD) and the 1.8TB rate for 1432TB (0.43 DWPD). Power consumption is stated as an average of 1.6W, and 1.5W at idle.
Specifications
- Form factor: 2.5"
- Interface:
SATA Rev. 3.0 (6Gb/s) - with backwards compatibility to SATA Rev. 2.0 (3Gb/s)
- Capacities:
400GB, 480GB, 800GB, 960GB, 1.6TB, 1.8TB
- Sequential Read/Write:
- 400GB - 555/535 MB/s
- 480GB - 555/535 MB/s
- 800GB - 555/530 MB/s
- 960GB - 555/520 MB/s
- 1600GB - 555/510 MB/s
- 1800GB - 555/500 MB/s
- Max Random 4k Read/Write:
- 400GB - 99,000/90,000 IOPS
- 480GB - 99,000/90,000 IOPS
- 800GB - 99,000/89,000 IOPS
- 960GB - 99,000/88,000 IOPS
- 1600GB - 100,000/88,000 IOPS
- 1800GB - 99,000/86,000 IOPS
- Steady-State 4k Read/Write :
- 400GB - 85,000/35,000 IOPS
- 480GB - 85,000/11,000 IOPS
- 800GB - 78,000/32,000 IOPS
- 960GB - 78,000/11,000 IOPS
- 1600GB - 78,000/32,000 IOPS
- 1800GB - 67,000/18,000 IOPS
- Quality of Service (Latency - Read/Write: <400 µs / <4 ms (99.9%)
- Hot-Plug Capable
- Static and Dynamic Wear Levelling
- Enterprise SMART tools: reliability tracking, usage statistics, life remaining, wear levelling, temperature
- Endurance:
- 480GB: 257TB (0.30 DWPD5)
- 960GB: 564TB (0.32 DWPD5)
- 400GB: 422TB (0.57 DWPD5)
- 800GB: 860TB
- (0.58 DWPD)
- 1600GB: 1678TB (0.57 DWPD5)
- 1800GB: 1432TB (0.43 DWPD5)
- Power consumption:
- Idle: 1.56W
- Average: 1.6W
- Max Read: 1.8W
- Max Write: 4.86W
- Storage temperature: -40°C ~ 85°C
- Operating temperature: 0°C ~ 70°C
- Dimensions: 69.9mm x 100mm x 7mm
- Weight: 92.34g
- Vibration operating:
2.17G peak (7-800Hz)
- Vibration non-operating:
20G peak (10-2000Hz)
- MTBF: 2 million hours
- Warranty/support: Limited 5-year warranty with free technical support
2. Package,software
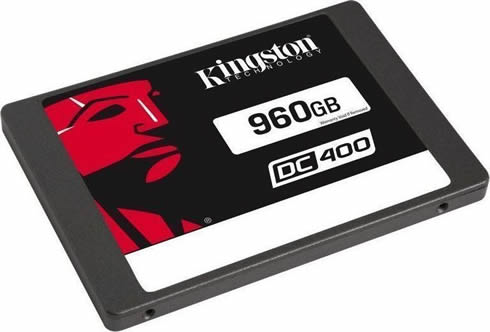
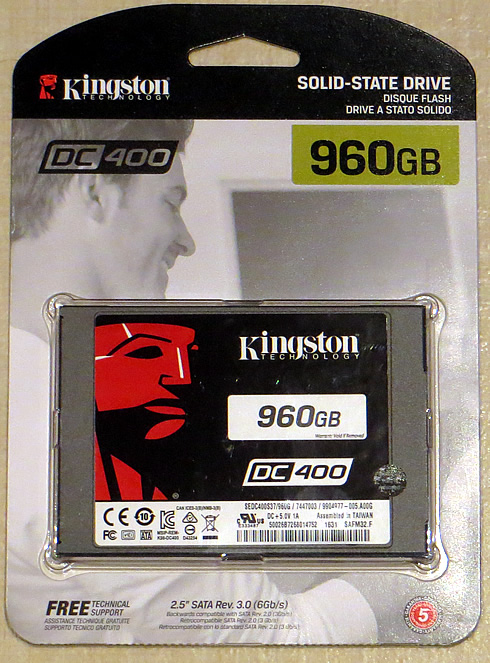
Below you see the retail package of the DC400 960GB SSD, along with the SSD itself.


Following the installation of the SATA SSD to our test PC, the Crystal Disk Info utility provides information about the drive, and confirms the basic features and specifications. The drive's firmware was Ver. SAFM32.F and the available capacity for us was 960,1GB:

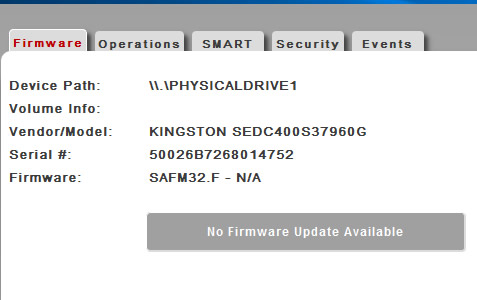
Below you see a series of screen shots of the The Kingston Storage Manager (KSM), is a Windows-based graphical user interface that offers you information about the overall condition and health of your SSD, but most importantly, it allows you to set the amount of reserved NAND that will be used for overprovisioning. Though the screenshots are cropped to better show you the details of KSM, you can click on each screeenshot to get a larger view.
Starting with the first tab of the software, you get information about the drive's firmware. Here you can also search online for any available update.
The data center use of SSD’s cannot be a one-size-fits-all approach. Some applications are
more read intensive and others more write intensive. Some applications will require an extended service
life so endurance will be a key consideration. Larger capacity and different application class drives are typically configured with proportionally bigger over-provisioning due to the resource requirements in managing more NAND Flash with the use of Garbage Collection, spare blocks and enhanced data protection features.
For DC400, Kingston has made it possible for a user to
manually configure the overprovisioning (OP) on their SSD to best fit the goals of the application and/or workload.
The Kingston Storage Manager has been designed to make
configuring OP on the DC400 quick and easy. The DC400 line of SSD’s is manufactured with a standard
OP configuration of approximately 7% from the factory. For example a 960GB DC400 actually has
1024GB of Flash Memory on the PCB but after Kingston configures the 7% OP at manufacturing time the
user has 960GB of usable capacity available to them.

With KSM, you can set any amount of OP they desire above the factory set OP configuration which
will increase the OP space available to the controller above the standard 7% OP . If at a later time the
required expectation of the drives change and more useable capacity is needed, you can simply
adjust the OP for more usable capacity or set the drive back to the factory OP configuration. Note that any
change in the OP configuration will result in data loss.
The figure below shows an example of the “Operations Tab” in KSM where OP can be configured on a
DC400. In this example we are beginning with a DC400 with a default factory configuration of 960GB.
You will simply enter the user capacity they desire in GB in the “desired capacity settings box” and
commit their changes:

For increased performance, a larger over-provisioned area on an SSD will primarily improve write IOPS
performance and lower application latency. As a general guideline, the largest improvements in
performance are obtained with an OP area between 7% and 28%. Configuring OP beyond 28% will result
in higher endurance for the SSD but the performance benefits may begin to diminish at this point.
Based on the SNIA standardized test data, you can see that the DC400 configured at 400GB
delivers 3x the sustained write IOPS performance over a standard DC400 configured at 480GB.
Application latency is also reduced with more OP across the read/write workload mix.
It is well known that SSD’s have a finite number of program and erase cycles per Flash Memory Cell.
Over-provisioning the DC400 SSD can offer greater Flash endurance by effectively lowering the write
amplification factor.
For example, a 1TB DC400 configured at 800GB capacity delivers
65% more write endurance than the drive configured at 960GB.
For our tests, we left the the OP at 7% OP so we had 960GB of usable capacity available.
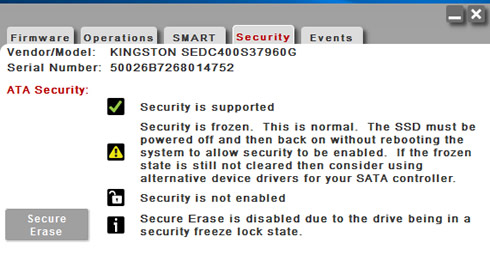
KMS provides additional information about the health of the SSD (SMART), security settings and and an event log:


3. HDTachRW, ATTO
Here is our testbed:
- Shuttle SH81R4
Processor: Intel i7 4790Graphics card: Club3D Radeon HD 6790 CoolStream EditionMemory: 2x8GB RAM DDR3-1600 CrucialSSD: 512GB Crucial MX100Monitor: LG L246WH-BH 24"
- Windows 7 x64 SP1 with latest updates installed
We start the tests with the HDTachRW software. The software measures the sequential read speed, the random access speed and sequential write speed. The software feeds the tested drive a continuous string of small sequential requests. It doesn't equate to real-world maximum throughput, but it does mean something for analysis.
The drive's reading speed was consistent throughout its capacity and the average read speed was at 467.8MB/s. The software's small sequential requests in the write part we handled well , and the average write speed was 426.6MB/s. A solid performance here:


The next software we used was the ATTO Disk Benchmark. The tool measures storage systems performance with various transfer sizes and test lengths for reads and writes. The benchmark performs file transfers ranging from 0.5 KB to 8192 KB. ATTO can be adjusted to do overlapped I/O, in a variety of queue depths. The test was run with the default runs of 0.5KB through 8MB transfer sizes with the total length being 256MB and QD4. ATTO probably gives the most accurate results for compressible read and write data:

ATTO is showing up to 562MB/s read and 524MB/s write speeds, with large 8MB files. As you see above, the drive's read performance was very high throughout the test. Writing was a bit slower in the first tests with small file sizes, ( until 4KB), but it was improved with larger files.
Let's plot these results to make some comparisons with other SSDs.
The Kingston DC400 960GB SSD was very fast in the 4KB read test (351.1MB/s), ranking higher than the Samsung 850Pro 256GB and the Crucial MX300 750GB:

Reading of larger 2MB files was also very fast at 561.8 MB/s. As you see below, many SSDs are competing in the 550 MB/s - 560 MB/s range, and their actual performance differences are obviously of no importance.

Writing of small 4K files was slower at about 255.6 MB/s. The drive favored the larger 2MB files and returned a write speed of 523.7 MB/s:


4. CrystalDiskMark
The next benchmark is the CrystalDiskMark. The software provides throughput data based on sequential reads and writes, and random (512K/4K/4KQD32) reads and writes of various sizes.

We start with the older version of the CrystalDiskMark, in order to compare the DC400's performance with other SSDs we have tested so far. Kingston's drive reached the 542 MB/s read and 493MB/s write in the standard sequential write test. The Random 4K performance on the drive was 33 MB/s read and 103MB/s write.
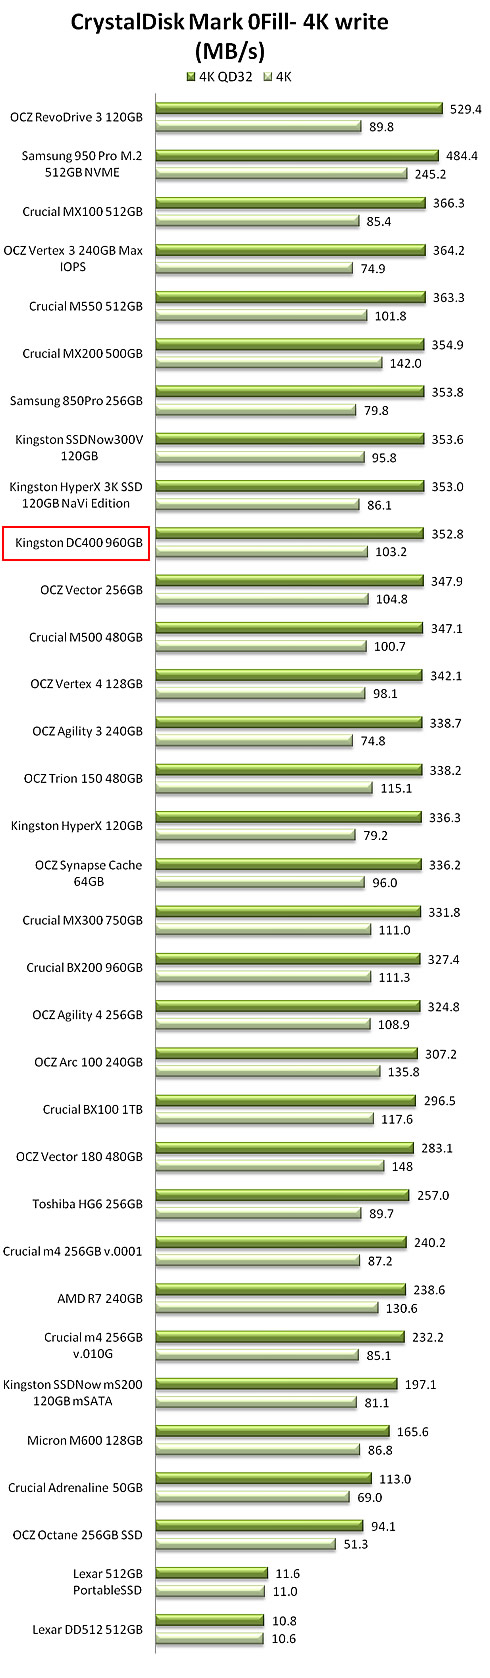
The results were not exactly the same when we ran the test again set to 0Fill mode. There was a big boost in the 4K read (127.4 MB/s) and 4K QD32 (399 MB/s) speeds:

The latest version of the CrystalDiskMark utility returned performance figures close to those quoted by Kingston. Sequential Q32T1 read/ write speeds were 561 MB/s and 522 MB/s , respectively. The drive handles reasonable deep queues of 4K data pretty well, mainly in the write part. It performs well with 4K writes and the Phison controller seems to prefer reading of compresses data, especially when dealing with 4K transactions:


The charts you see below are based on the data coming from CrystalDiskMark v3.0.4. The DC400 960GB ranks pretty well in the first chart (sequential read speed) as well as in the 4K random read chart, in both QD1 and QD32 tests:


In the sequential and 4K/4KQD32 write speeds of the DC400 were also fast:

5. AS SSD
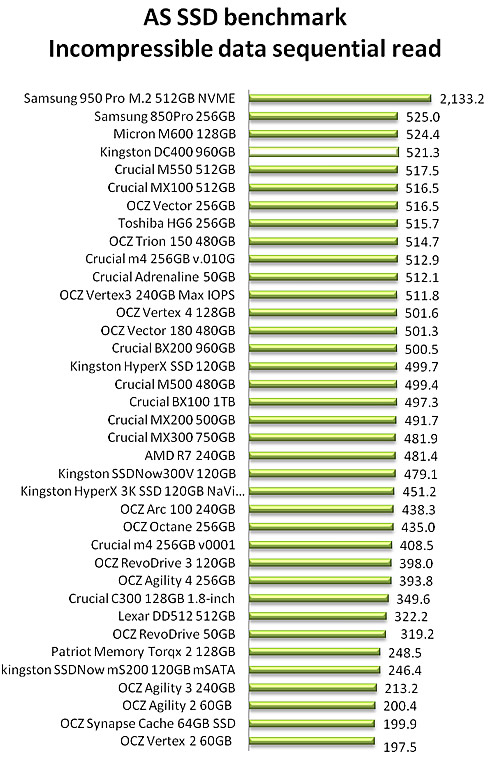
We move on with the AS SSD benchmark, which contains five synthetic as well as three practical tests. The synthetic tests determine the sequential and the random read / write performance of an SSD. These tests are carried out without using the operating system's cache. The Seq-test measures how long it takes to read and write an 1GB file. Most importantly, this sequential benchmark uses incompressible data for all of its transfers.
The Kingston DC400 960GB SSD reached a score of 1143. Sequential speeds hit 521.34MB/s for reads and 478.45MB/s write while 4K speeds reached 42.31MB/s for read and 89.23MB/s for write. Overall. the results are more than adequate:


The DC400 was among the fastest drives we have tested in terms of sequential and 4K random read speeds:

The DC400 remained fast in the 4K 64 thread random read test:

The performance for the sequential write test was high, and remained within the acceptable limits in the 4K and 4K64 random write tests, although some drives were faster:


Next up we ran the Compression Benchmark built-into AS SSD. This test uses a mix of compressible and incompressible data and outputs both Read and Write throughput of the drive.
The Kingston DC400 SSD showed a stable behavior across the board, save for a few dips of a few MB/s in the write test. The compressibility of the data being transferred or read had little to no impact on the performance:

6. IOMeter
The IOMeter benchmark is run by using workstation and database patterns for queue depths (outstanding I/Os) representing very light and moderate loads. Iometer is both a workload generator (that is, it performs I/O operations in order to stress the system) and a measurement tool (that is, it examines and records the performance of its I/O operations and their impact on the system). The app's ability to bombard drives with an escalating number of concurrent IO requests also does a nice job of simulating the sort of demanding multi-user environments that are common in enterprise applications.

Overall, the IOPS delivered by the Kingston DC400 960GB SSD were not the highest we have seen, in both read and write tasks:


7. Anvil Pro
The next benchmark is the Anvil Pro, an ‘all inclusive’ storage utility. The software is tests transfer speeds as well as IOPS The IOPS tests can be configurable with preset testing scenarios for read (Seq 4MB, 4K, 4K QD4, 4K QD16, 32K and 128K), write (Seq 4MB, 4K, 4K QD4, 4K QD16) and mixed IO.
We used the software with the Crucial MX300 SSD and tested the drive with 0-fill compression (RAW), 8% compression, 25% compression, 45% compression, 67% compression and finally 100 % (incompressible data).
Generally, the results we got from the Anvil Pro benchmark confirmed the consistent performance of the Kingston DC400 960 GB across different compressions, with an exception with 0-fill data. In that case, the 4K read performance of the drive was much higher. You can check the breakdown of the drive's results in the various tests by following the provided links above. The performance is in line with what we have seen in the other tests.
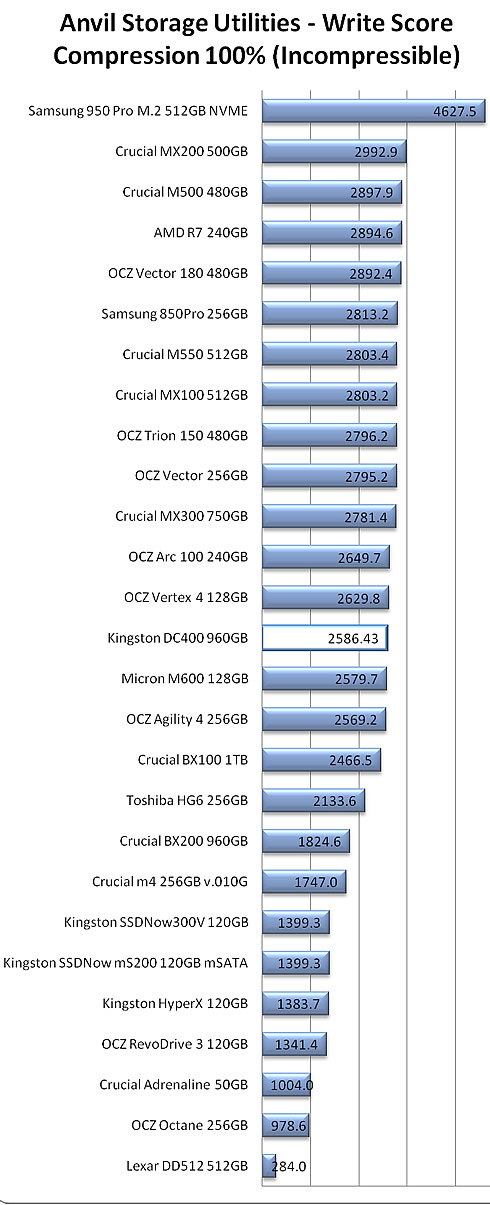
We have created charts for the read, write and total score of the Kingston DC400 960GB SSD in the benchmarks with both 0-fill and incompressible data.
Overall, theDC400 SSD was faster than the OCZ Trion 150 drive in the total score chart, mainly due to the very fast read performance:


With total incompressible data, the DC400 SSD ranked somewhere in the middle of the charts:


8. PCMark 7, PCMark 8
PCMark 7's Secondary Storage benchmark module offers a real-world application measurement approach to testing. The benchmark offers a trace-based measurement of system response times under various scripted workloads of traditional client / desktop system operation. From simple application start-up performance, to data streaming from a drive in a game engine, and video editing, these tests illustrate the performance profile of SSDs in a consumer PC usage model.

Below you see the secondary storage scores of some of the SSDs we have tested so far. The Kingston DC400 SSD is not the faster performer in the charts below, and trailed overall in the PCMark storage benchmark.

We continue with the PCMark 8 Storage benchmark, which uses traces recorded from Adobe Creative Suite, Microsoft Office and a selection of popular games. Unlike synthetic storage tests, the PCMark 8 Storage benchmark highlights real-world performance differences between storage devices.
We ran the storage benchmark test suite:

The overall score for the DC400 SSD was just 4974 points, which is lower than the scores of other SSDs.

9. Summary
The DC400 SSD is armed with features tailored to the needs of the enterprise environment - end-to-end data path protection, hardware encryption, SmartECC, high endurance, SmartRefresh and firmware-controlled power loss management. Its enterprise firmware improves latency and helps DC400 deliver consistently low data access times under steady state workloads.
Datacenter use of SSD’s cannot be a one-size-fits-all approach - some applications are more read intensive and others more write intensive. Kingston’s DC400 SSD 960GB offers user-adjustable over-provisioning to improve random IOPs performance.
Depending on the application class and capacity of the SSD, an increased reserve capacity of NAND flash memory can be allocated as an over-provisioned (OP) spare capacity. The OP capacity is hidden from user and operating system access and can be utilized as a temporary write buffer for higher sustained performance and as a replacement of defective flash memory cells during the life-expectancy of the SSD to enhance the reliability and endurance of the SSD. The DC400 960GB SSD we tested allows for user-adjustable over-provisioning, meaning that you can manually set the amount NAND that will be allocated to the overprovisioned area, in order to get better performance and better endurance. This can be easily done through the Kingston Storage Manager (KSM), is a Windows-based graphical user interface. Since the manually configure the overprovisioning on the SSD lets you fit the goals of the application and/or workload.
We ran all our tests with the standard 7% OP . But for increased performance, a larger over-provisioned area on an SSD will primarily improve write IOPS
performance and lower application latency. As a general guideline, the largest improvements in
performance are obtained with an OP area between 7% and 28%. Configuring OP beyond 28% will result
in higher endurance for the SSD but the performance benefits may begin to diminish at this point.
Kingston is also offering a performance-optimized model of the DC400 (400/800GB).
This model offers greater IOPs for faster application performance and reduced storage latencies that result in faster user response times. But if your needs include read-intensive workloads, a factory-tuned, read-optimized model offers read-intensive performance and more affordable per gigabyte. It’s available in 1800GB capacity and by special order only.
The quoted sequential read /write figures for the DC400 960GB SSD were confirmed, along with the quoted random read and write figures. The drive was fast in 4K random read tests, and remained fast in its steady state. It showed its strengths in 4K random reads with both compressible and incompressible data and in QD1~QD32, as well as in 4K64 reads.
In the write tests, the DC400 960GB returned adequate performance a 4K compressible writes in QD1 / QD32, but it could be a bit faster in
incompressible 4K, 4K64 random writes.
We would also like to see higher results in the demanding IOmeter benchmark, where we bombard the drive with an escalating number of concurrent IO requests, simulating the sort of demanding multi-user environments.
The DC 400 960GB retails for $388, which is a very competitive price.