1. Introduction
- Introduction
 So you have your new Linux-based system up and running. But you also need to monitor its status and be prepared for possible failures or determine causes of hardware instability. Modern PCs support a variety of tools to help you, and you'll be surprised to learn that with a few simple applications you can probe a number of functional parameters, like hard drive temperature, CPU fan speed and GPU clock. The list of tools shown here is by no means exhaustive, but should serve as a reasonable starting point for most desktop systems. There are more sophisticated tools to be found for server use, or ones which address highly specific needs.
-
SMART status
Modern hard drives constantly monitor their functional parameters, including temperature, power-on hours, reallocated sector count, hardware ECC recovered data using a technology known as SMART. As a matter of fact, S.M.A.R.T. is an acronym for “Self Monitoring Analysis and Reporting Technology”. Recent research has shown that some of the SMART attributes may be useful for predicting hard drive failures. As a general rule, even though hard drives frequently fail abruptly, without previous indication of malfunction, the existence of a SMART error greatly increases the probability of failure. Specifically, scan errors, sector reallocations and sector probational counts mean that the drive is very likely to fail within 60 days.
Fortunately, you can use a simple set of tools called “smartmontools” that allow you to view this information, store it in a log file, periodically run automatic hard drive tests and even receive automatically generated email warnings in case of hard drive errors. Smartmontools can be obtained from Sourceforge (source version) but it is probably already included in your favorite distribution.
After the installation you can probe your hard drives for information with the following simple command:
- root@hagakure:~# smartctl -d ata -a /dev/sda
- smartctl version 5.36 [i686-pc-linux-gnu] Copyright (C) 2002-6 Bruce Allen
- Home page is http://smartmontools.sourceforge.net/
-
- === START OF INFORMATION SECTION ===
- Device Model: SAMSUNG SP1614C
- Serial Number: 0696J1FX906990
- Firmware Version: SW100-25
- User Capacity: 160,041,885,696 bytes
- Device is: In smartctl database [for details use: -P show]
- ATA Version is: 7
- ATA Standard is: ATA/ATAPI-7 T13 1532D revision 0
- Local Time is: Fri Apr 6 18:20:46 2007 EEST
- ==> WARNING: May need -F samsung2 disabled; see manual for details.
- SMART support is: Available - device has SMART capability.
- SMART support is: Enabled
- === START OF READ SMART DATA SECTION ===
- SMART overall-health self-assessment test result: PASSED
- [............ REMOVED TEXT.................]
- SMART Attributes Data Structure revision number: 16
- Vendor Specific SMART Attributes with Thresholds:
- ID# ATTRIBUTE_NAME FLAG VALUE WORST THRESH TYPE UPDATED WHEN_FAILED RAW_VALUE
- 1 Raw_Read_Error_Rate 0x000b 100 100 051 Pre-fail Always - 9
- 3 Spin_Up_Time 0x0007 068 057 000 Pre-fail Always - 5632
- 4 Start_Stop_Count 0x0032 100 100 000 Old_age Always - 458
- 5 Reallocated_Sector_Ct 0x0033 253 253 010 Pre-fail Always - 0
- 7 Seek_Error_Rate 0x000b 253 253 051 Pre-fail Always - 0
- 8 Seek_Time_Performance 0x0024 253 253 000 Old_age Offline - 0
- 9 Power_On_Half_Minutes 0x0032 098 098 000 Old_age Always - 11821h+44m
- 10 Spin_Retry_Count 0x0013 253 253 049 Pre-fail Always - 0
- 12 Power_Cycle_Count 0x0032 100 100 000 Old_age Always - 458
- 194 Temperature_Celsius 0x0022 193 112 000 Old_age Always - 15
- 195 Hardware_ECC_Recovered 0x000a 100 100 000 Old_age Always - 157734777
- 196 Reallocated_Event_Count 0x0012 253 253 000 Old_age Always - 0
- 197 Current_Pending_Sector 0x0033 253 253 010 Pre-fail Always - 0
- 198 Offline_Uncorrectable 0x0031 253 253 010 Pre-fail Offline - 0
- 199 UDMA_CRC_Error_Count 0x000b 100 100 051 Pre-fail Always - 0
- 200 Multi_Zone_Error_Rate 0x000b 100 100 051 Pre-fail Always - 0
- 201 Soft_Read_Error_Rate 0x000b 100 100 051 Pre-fail Always - 0
- [..............REMOVED TEXT...............]
- SMART Self-test log structure revision number 1
- Num Test_Description Status Remaining LifeTime(hours) LBA_of_first_error
- # 1 Extended offline Completed without error 00% 11622 -
- # 2 Extended offline Completed without error 00% 11466 -
- # 3 Extended offline Completed without error 00% 11310 -
- # 4 Extended offline Completed without error 00% 11153 -
- # 5 Extended offline Completed without error 00% 10996 -
- # 6 Extended offline Completed without error 00% 10357 -
- # 7 Short offline Completed without error 00% 10355 -
- # 8 Short offline Completed without error 00% 8167 -
- # 9 Extended offline Completed without error 00% 7736 -
- #10 Extended offline Completed without error 00% 7621 -
- #11 Extended offline Completed without error 00% 6575 -
- #12 Short offline Completed without error 00% 6573 -
- Device does not support Selective Self Tests/Logging
2. Smart Status Page 2
- SMART status Page 2
The information will depend on your exact hard drive model and manufacturer, but certain items are certainly present. Of particular note are the items underlined in light blue, but any error should be generally considered suspicious. The power-on time is a good measure of the operating lifetime of your hard drive: expect most drives to fail before 3000 hours (usually within warranty, due to bad construction) and after 20000 hours (old age), which translates to approximately 2 months and a little over 2 years continuous use, respectively. Temperature is generally not very important, unless extreme values are noted. A good operating temperature for most drives is between 10°-40° C. In the example shown above, a 12cm fan blowing directly on the drive cools it to 15° which is OK.
Useful commands are:
View info for drive /dev/sda. Note that the switch -d ata may be needed if your drive is SATA, but is not required for ATA drives.
-
smartctl -d ata -a /dev/sda
Enable SMART:
-
smartctl -d ata -s on /dev/sda
Run a short offline test (use smartctl -a, as shown above, to view the results) :
-
smartctl -d ata -t short /dev/sda
Run a long offline test:
-
smartctl -d ata -t long /dev/sda
Admittedly, the most interesting part of the smartmontools suite is the ability to run SMART monitoring as a unix deamon. The application is named “smartd” and can be started during the boot process by your initialization scripts (check your distribution for how to do this---may already be started). The configuration of smartd is very simple and requires a single configuration file named “smartd.conf”, which usually resides in /etc/smartd.conf.
Here is an example of a very, very simple smartd.conf file:
- # Sample configuration file for smartd. See man smartd.conf.
-
- # Home page is: http://smartmontools.sourceforge.net
-
- # $Id: smartd.conf,v 1.33 2004/01/13 16:53:06 ballen4705 Exp $
-
- # smartd will re-read the configuration file if it receives a HUP
- # signal
-
- # The file gives a list of devices to monitor using smartd, with one
- # device per line. Text after a hash (#) is ignored, and you may use
- # spaces and tabs for white space. You may use '\' to continue lines.
-
- # You can usually identify which hard disks are on your system by
- # looking in /proc/ide and in /proc/scsi.
-
- # The word DEVICESCAN will cause any remaining lines in this
- # configuration file to be ignored: it tells smartd to scan for all
- # ATA and SCSI devices. DEVICESCAN may be followed by any of the
- # Directives listed below, which will be applied to all devices that
- # are found. Most users should comment out DEVICESCAN and explicitly
- # list the devices that they wish to monitor.
- DEVICESCAN
The only line of interest is the last one (all previous lines a re comments), which tells smartd to scan for SMART devices and enable monitoring whenever possible. This option does not run any tests.
We can do better than that with a custom smartd.conf file, as follows (file contains only these two lines):
- /dev/sda -d ata -s L/../../3/06
- /dev/sdb -d ata -s L/../../7/06
This instructs smartd that we have two SMART devices, /dev/sda and /dev/sdb which must be monitored. The “-d ata” switch may be necessary for SATA devices. The last argument “-s L/../../3/18” requests a background hard disk test whenever the expression matches the date. The format is “L” or “S” for a long or short test, respectively and “/MM/DD/d/HH” (month, day of the month, day of the week, 24-hour) for the pattern to be followed. In this case, /dev/sda is scanned on the third day of the week (Wednesday) at 06am, every week, while /dev/sdb is scanned on Sundays, again at 06am.
Everyday short tests can be enabled in addition to weekly long tests. This example runs a short test on drive /dev/sda at 02:00am every day AND a long test every Saturday 03:00am.
- /dev/sda -d ata -s (S/../.././02|L/../../6/03)
You can also ask for an email warning if the SMART status reports an error. Here is an example which instructs smartd to send an email in case of any error.
- /dev/sda -d ata -s L/../../6/03 -l error -m l33t_hax0r@mymail.net
The output in your log file (syslog) will be rather verbose, but should not cause any worries. Here is an excerpt from my /var/log/messages file:
- Apr 1 20:32:16 hagakure smartd[4430]: Device: /dev/sda, SMART Usage Attribute: 194 Temperature_Celsius changed from 193 to 199
- Apr 1 21:02:16 hagakure smartd[4430]: Device: /dev/sdb, SMART Usage Attribute: 190 Unknown_Attribute changed from 70 to 71
- Apr 1 21:02:16 hagakure smartd[4430]: Device: /dev/sdb, SMART Usage Attribute: 194 Temperature_Celsius changed from 30 to 29
Note that /dev/sda and /dev/sdb report temperatures differently. Smartd also detected a change in an unknown attribute.
3. Sensor/GPU Monitoring
-
Sensor monitoring
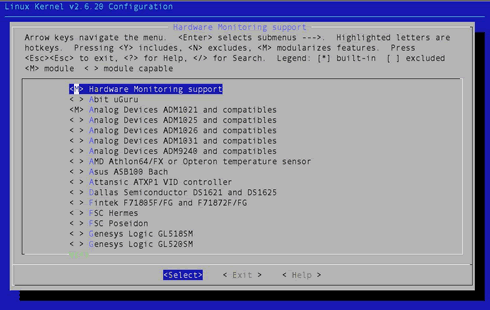
You probably know that your motherboard has various sensors which, among other things, measure voltage, fan rpm and various temperatures. These are usually accessible via an on-board chip, which is typically supported by modern Linux kernels. You will need to enable the appropriate driver in the kernel configuration menu. If, like most people, you don't know the exact chip on your motherboard, you can either choose to enable all of them (preferably as modules) or use the “sensors-detect” utility, which is part of the “sensors” package. The relevant kernel configuration section can be found under Drivers → Hardware Monitoring support, as shown below (kernel 2.6.20):
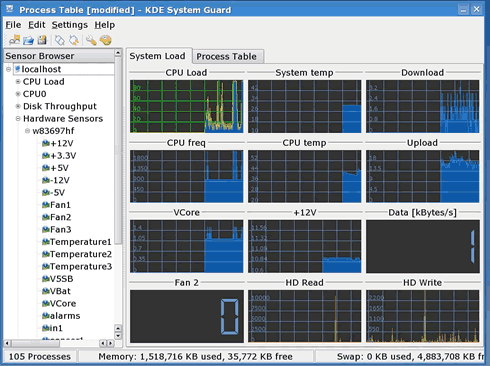
Luckily, many chips are supported. In my case it is a Winbond W83697 that the kernel promptly recognizes. You can then use various software packages to read the values, but bear in mind that their accuracy may vary. A simple solution is ksysguard, but the sensors package also provides a command line utility, similar in spirit to smartmontools. Here is a screencapture of ksysguard:
Nvidia GPU monitoring
 You can also monitor your nVidia graphics card with a simple but powerful program called “nvclock”. This utility prints lots of information about your graphics card and can also help in setting various options (anisotropic filtering, FSAA). You can also use it to overclock your GPU or graphics memory (generally not advised) or change fan speed.
Here is the information that nvclock prints:
- root@hagakure:~# nvclock -i
- -- General info --
- Card: nVidia Geforce 6600GT
- Architecture: NV43 A4
- PCI id: 0xf1
- GPU clock: 299.250 MHz
- Bustype: AGP (BR02)
-
- -- Pipeline info --
- Pixel units: 8 (11b)
- Vertex units: 3 (111b)
- HW masked units: None
- SW masked units: None
-
- -- Memory info --
- Amount: 128 MB
- Type: 128 bit DDR
- Clock: 899.999 MHz
-
- -- Sensor info --
- Sensor: National Semiconductor LM99
- Board temperature: 40C
- GPU temperature: 52C
- Fanspeed: 50.0%
-
- -- VideoBios information --
- Version: 05.43.02.39.00
- Signon message: ASUS N6600GT VGA BIOS Version 5.43.02.39.AS39
- Performance level 0: gpu 300MHz/memory 900MHz/1.30V
- Performance level 1: gpu 500MHz/memory 900MHz/1.40V
- VID mask: 3
- Voltage level 0: 1.30V, VID: 0
- Voltage level 1: 1.40V, VID: 3
I usually reduce fanspeed with the -f and -F options. It's a nice trick if your graphics card produces an awful lot of noise (unfortunately, many of them do):
- root@hagakure:~# nvclock -f -F 50
- Current fanspeed: 100.0%
- Changing fanspeed from 100.0% to 50.0%
- New fanspeed: 50.0%
Note that nvclock also has nice GTK and Qt GUI interfaces for those that hate the command line.
Conclusion
There are many tools that allow you to monitor your hardware under Linux. The examples given above are just a few, but they do give an overview of the possibilities. By carefully inspecting the status of your hardware, you can predict failures or pinpoint their causes. Above all, it's a neat trick. Have fun!