1. Introduction
 Dual Core processors are the latest addition to the CPU market, hitting the streets almost a year ago. In August 2004, AMD was the first x86 processor
manufacturer to demonstrate a fully functioning dual-core
processor on a shipping platform. Placing two computing cores on
a single processor opens up a world of new possibilities. More efficient processing power can more easily handle multiple tasks simultaneously while there is a base for future, more demanding software and games.
Dual Core processors are the latest addition to the CPU market, hitting the streets almost a year ago. In August 2004, AMD was the first x86 processor
manufacturer to demonstrate a fully functioning dual-core
processor on a shipping platform. Placing two computing cores on
a single processor opens up a world of new possibilities. More efficient processing power can more easily handle multiple tasks simultaneously while there is a base for future, more demanding software and games.

Features
The AMD64 core provides leading-edge 32-bit performance and support for future 64-bit applications
- AMD64 technology provides full-speed support for x86 code base for uncompromising 32-bit performance, ready for 64-bit applications
- 40-bit physical addresses, 48-bit virtual addresses
- Eight new (sixteen total) 64-bit integer registers
- Eight (sixteen total) 128-bit SSE/SSE2/SSE3 registers
- Including support for 3DNow!™ Professional technology and SSE3
The Industry’s first true on-die dual core x86 PC processor
- Inter-core communication at CPU speed
- Direct access to memory controller & HyperTransport™ technology link
Cool‘n’Quiet™ technology for a quieter computer and lower power costs
- Recognized in 2005 by the U.S. Environmental Protection Agency for the advancement of energy efficient computer technology.
HyperTransport™ technology for high speed I/O communication
- One 16-bit link at 2000MHz
- 8 GB/s HyperTransport™ technology I/O bandwidth
- 14.4 GB/s total delivered processor-to-system bandwidth
Large high-performance on-chip cache
- 64KB Level 1 instruction cache per core (128KB total)
- 64KB Level 1 data cache per core (128KB total)
- Up to 1MB Level 2 cache per core (2MB total)

| Processor |
AMD Athlon 64 X2 Dual-core |
| Model |
4800+ |
4600+ |
4400+ |
4200+ |
3800+ |
| Stepping |
E6 |
E4/E6 |
| Operating Mode |
32/64 |
| Frequency |
2400Mhz |
2200Mhz |
2000Mhz |
| HT Speed |
2000 |
| Voltage |
1.35-1.40 V |
| Max Temp |
65°C |
71°C |
65°C |
71°C |
| Thermal Power |
110W |
89W |
| L1 Cache |
128KB + 128KB |
128KB |
128KB + 128KB |
| L2 Cache |
1MB x2 |
512KB x2 |
1MB x2 |
512KB x2 |
| CMOS Technology |
90nm SOI |
| Socket |
Socket 939 |
Immediate customer benefits of multi-core
processors:
• Multi-core processors have the potential to run
applications more efficiently than single-core
processors - giving users the ability to keep
working even while running the most processor intensive
tasks in the background, like searching
a database, rendering a 3D image, ripping and
burning music files to a CD, or downloading
videos off the Web
• Multi-threaded software applications - programs that run multiple tasks (threads)
at the same time to increase performance for
heavy workload scenarios, such as data mining,
mathematical analysis, and Web serving, are
already positioned to take advantage of
multi-core processors
• Multi-core processors offer increased
productivity within the same computing
infrastructure companies are using today
Long-term benefits of multi-core processors:
• Multi-core computers have the ability to run
today’s applications as well as tomorrow’s more
complex applications, which means that the
hardware will retain its value over time
• The growing complexity of software, as well as
the desire of users to run multiple applications
at the same time, will accelerate widespread
adoption of multi-core processor-based
systems. This will give commercial applications the ability to handle large amounts of data and more users faster and more efficiently, while consumers will experience richer features and more functionality, especially for applications like digital media and digital content creation
• Next-generation software applications will require the performance capacity provided by multi-core processors. Software destined to break barriers in the user experience, like voice recognition and/or artificial intelligence (AI), will be possible with multi-core processors
• Expanded roles for PCs due to increased performance capacity,multi-core processor based PCs will be leveraged for new tasks, including serving as the hub for digital entertainment in the home
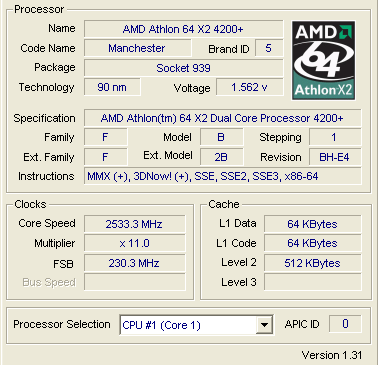
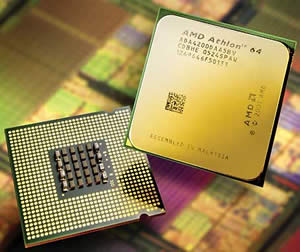
Up until now, we have had the opportunity to review two Dual Core processors from Intel, the D 820 and the D 840. In this review, it's AMD's turn with the 4200+ X2 processor. The CPU runs at 2.2GHz while each core has 512KB L2 Cache.
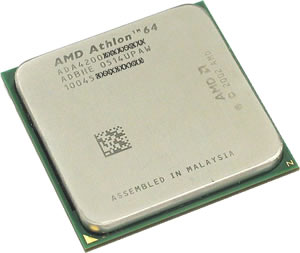

The retail box includes the processor, the stock cooling system and the warranty. In our case, we only received the processor, without a cooling system so we used a readily available cooler from Thermaltake.
Throughout this review, we will be posting the test results for the AMD 4200+ X2 along with the results of the two other dual core processors from Intel that we've tested, the D 820 and D 840.
2. System Setup
In Device Manager, you'll notice that the AMD 4200+ X2 is identified as two processors, while with CPU-Z you can access the details for each core separately.

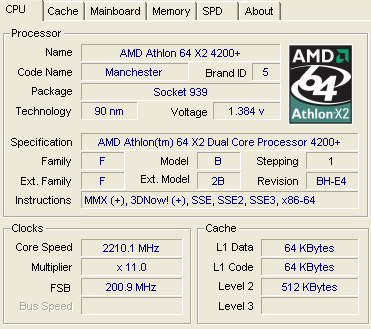
The default FSB is set at 200MHz while the the multiplier is 11.
Since we received the AMD processor without the stock cooling system, we used our own from Thermaltake, the Silent Water. The reported temperatures from SpeedFan are more than satisfactory, in fact, excellent. The system in idle (i.e. no tasks running other than the operating system) reported 21°C while under the stress test in Prime95, 28°C. The room temperature during our tests was 21°C. This rather low temperature might be a result of the very efficient cooling system but if we compare it to the temperature range that our AMD 3500 reported (29°C to 39°C), it seems that AMD has done a great job with this Processor. With such low temperatures, there's really no comparison with Intel's Dual Core processors.

Here's a rundown of our test bed, used to test the AMD 4200+ X2 processor:
System Specifications:
CPU: AMD 4200+ X2
Cooler: Thermaltake Silent Water
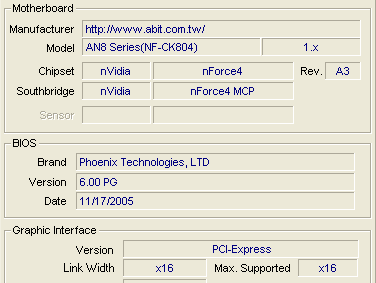
Motherboard: ABIT AN8 Fatal1ty
Power supply: Thermaltake PurePower 520W
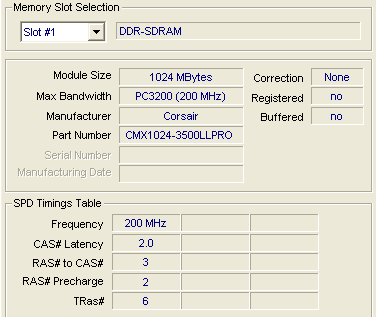
Memory: 2X1024MB Corsair CMX1024-3500LLPRO (dual channel)
VGA: AOPEN Aelous 6800Ultra
Hard Disk Drive: WD800JD 80GB 7200RPM
OS: Windows XP Pro SP2
Drivers: 81.89
DirectX: v9.0
Benchmarks & Applications used
- Sisoft Sandra 2005
- Prime95
- PcMark04
- 3DMark01
- 3DMark03
- 3DMark05
- PassMark Performance Test V5.0
- Half Life 2 - VST
- Asus Probe 2.23
- FlaskMPEG
- DVD Shrink
- dBPower
- WinRAR
- CPU-Z
3. SiSoftware Sandra 2005
SiSoftware Sandra is a 32 and 64-bit Windows system analyser that includes benchmarking, testing and listing modules. It also provides information on the CPU, chipset, video adapter, ports, printers, sound card, memory, network, Windows internals, AGP, ODBC Connections, USB2, Firewire, etc.
The new updated version of SiSoftware Sandra includes different benchmarks, therefore we used for our comparison charts, the reference results from SiSoftware Sandra.
The CPU Arithmetic benchmark:
Multi-Processor (SMP) support for up to 32/64 CPUs & SMT.
- Test takes about 20/30 seconds on P6-class PCs
- Test is repeated 3 to 5 times to get a realistic result
- Results outside the confidence limits (5%) are discarded
- Command Line Switch: CPUAABench
- Requirements: None
- OS (Win32) Support: Windows 2000, XP, 2003
- OS (Win32 CE) Support: PocketPC 2000/2002/2003, SmartPhone 2002, 2003
- OS (Win64) Support: Windows XP/2003
Sandra's CPU arithmetic benchmark suite uses 2 famous benchmarks (Dhrystone and Whetstone) for stress testing the processor. It also includes a new version of the Whetstone test that makes use of a processor's SSE2 instructions to show the performance boost an application might gain should it be optimized for SSE2. Unfortunately, this does not always represent true real-life performance, but is useful for comparing the speed of various CPUs.

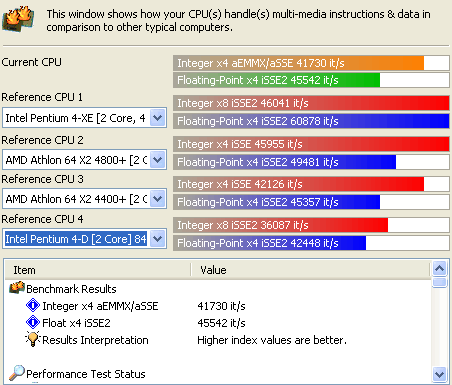
The CPU Multi-Media benchmark:
- Multi-Processor (SMP) support for up to 32/64 CPUs & SMT.
- Test takes about 20 seconds on P6-class PCs.
- Test is repeated 3 to 5 times to get a realistic result.
- Results outside the confidence limits (5%) are discarded.
- Command Line Switch: CPUMMBench
- Requirements: MMX (Enhanced), 3DNow! (Enhanced) or SSE(2/3) recommended
- OS (Win32) Support: Windows 2000, XP, 2003
- OS (Win64) Support: Windows XP/2003
The test has two parts:
Integer test - using integer data:
- MP SSE3 is used for better performance if supported.
- MP SSE2 is used for better performance if supported.
- MP SSE (Streaming SIMD) is used for better performance if supported.
- MP Enhanced MMX is used for better performance if supported.
- MP MMX is used for better performance if supported.
- MP ALU is used otherwise.
Floating-point test - using floating point data:
- MP SSE3 is used for better performance if supported.
- MP SSE2 is used for better performance if supported.
- MP SSE (Streaming SIMD) is used for better performance if supported.
- MP 3DNow! Enhanced is used for better performance if supported.
- MP 3DNow! is used for better performance if supported.
- MP FPU is used is used otherwise.
This test involves the generation of Mandelbrot Set fractals that are used to realistically describe and generate natural objects such as mountains or clouds. By using various multi-media extensions (MMX), 3DNow! and SSE(2/3) better performance is achieved.
4. PCMark04 - 05
PCMark04 and 2005 are application-based benchmarks and a premium tool for measuring overall PC performance. They use portions of real applications instead of including very large applications or using specifically created code. This allows them to be smaller installations as well as to report very accurate results. As far as possible, PCMark04 and 2005 use public domain applications whose source code can be freely examined by any user.
Both PCMark04 and PCMark05 include 4 categorized suites for benchmarking your computer. These include CPU, Graphics, Memory and a Hard Disk Drive benchmark. In our case, we selected only the CPU test suite.
- PCMark2004

According to PCMark04, the performance of the AMD 4200+ X2 Dual Core processor is placed somewhere in the middle, between the D 840 and D 820. As you can see in the following table, with the test results presented analytically, there are tasks where the 4200+ is faster than the D 840, while in others, closer to the D 820.
| |
D 820 |
4200+ X2 |
D 840 |
| File Compression (MB/sec) |
6.0 |
6.1 |
6.9 |
| File Encryption (MB/sec) |
80.4 |
68.2 |
92.3 |
| File Decompression (MB/sec) |
55.5 |
55.4 |
64.0 |
| Image Processing (MPixels/sec) |
23.8 |
27.1 |
27.6 |
| Grammar Check (KB/sec) |
4.1 |
6.1 |
4.8 |
| File Decryption (MB/sec) |
79.9 |
67.8 |
91.9 |
| Audio Conversion (KB/sec) |
2183.0 |
2925.9 |
2508.0 |
| WMV Video Compression (FPS) |
63.6 |
80.6 |
75.8 |
| DivX Video Compression (FPS) |
76.8 |
84.0 |
88.0 |
- PCMark2005
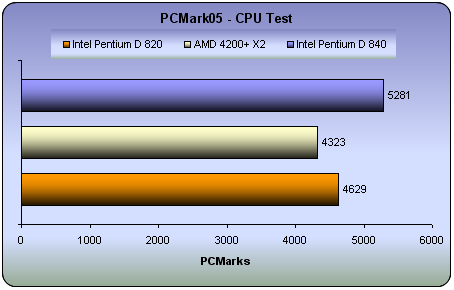
According to the PCMark2005 benchmark, the Intel processors are more powerful than the AMD. However, as you will notice in the table below, in many tasks, the AMD is far superior as is the case with File Compression and Decompression or Audio Compression. In the first Multithreaded test, none of the three processors lost in performance due to multithreading, compared to the same tests without multithreading. In the second Multithreaded test, all three processors halved in performance with all four threads running.
| |
D 820 |
4200+ X2 |
D 840 |
| File Compression (MB/sec) |
7.276 |
8.512 |
8.090 |
| File Decompression (MB/sec) |
110.438 |
131.572 |
128.221 |
| File Encryption (MB/sec) |
63.862 |
41.833 |
73.528 |
| File Decryption (MB/sec) |
61.808 |
37.724 |
70.689 |
| Image Decompression (MPixels/sec) |
22.633 |
25.333 |
25.991 |
| Audio Compression (KB/sec) |
1835.877 |
2499.359 |
2117.081 |
| Multithreaded Test 1 |
| File Compression (MB/sec) |
7.270 |
8.531 |
8.012 |
| File Encryption (MB/sec) |
63.504 |
42.008 |
73.385 |
| Multithreaded Test 2 |
| File Decompression (MB/sec) |
55.681 |
65.843 |
63.249 |
| File Decryption (MB/sec) |
30.634 |
19.000 |
35.716 |
| Audio Decompression (KB/sec) |
888.453 |
999.819 |
1003.015 |
| Image Decompression (MPixels/sec) |
11.363 |
12.772 |
12.895 |
The conclusion we can come to, looking at the above table is that with the single thread applications, only one of the two cores is used. With Multithread Test 1 where two threads are running, one thread is handled by each core. When we go to the Multithreaded Test 2, each core must now handle 2 threads which is why we get approximately half the performance of the single thread tests.
5. 3DMark2001
3DMark2001 SE is a diagnostics tool for measuring the 3D game performance of PCs. It is entertaining and easy to use, which makes it "must have" software for all home PC users interested in 3D games. Even a beginner PC user can get a game performance measurement with 3DMark2001 SE.
Although the 3DMark series is more suited to 3D graphics performance, it is nevertheless interesting to see how or if a faster CPU, helps the VGA's GPU achieve higher FPS.
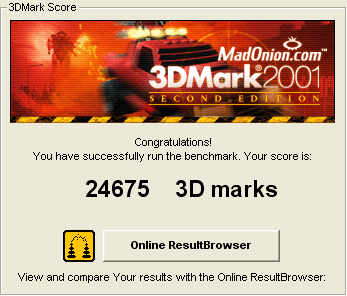
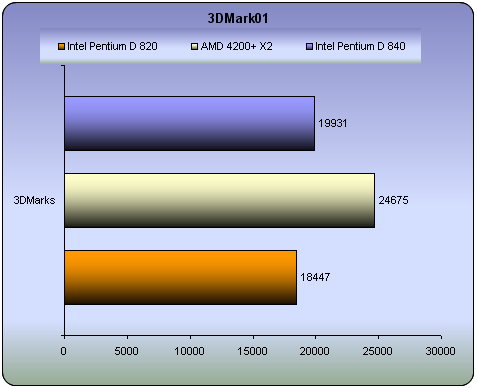
Quite a difference in games performance between the AMD and Intel processors, according to 3DMark01.
6. 3DMark2003
3DMark is a widely used and accepted benchmark that stresses the DirectX performance of a VGA card. For testing the performance of each card we use the 4 game benchmark 3DMark offers. The first is a DirectX 7 game, the second and the third use DirectX 8 and the last one stresses graphics in DirectX 9. A very strong point of 3DMark is that its VGA card measuring does not require a lot of CPU power. So the resulting fps are a good reference of a VGA card's rendering performance.
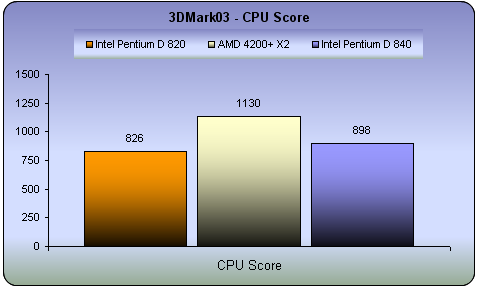
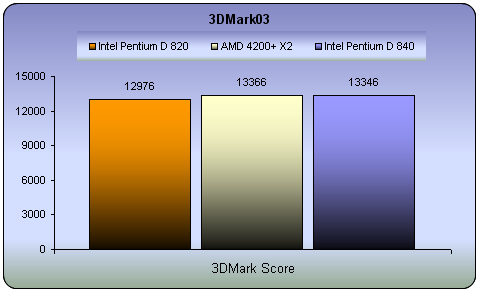
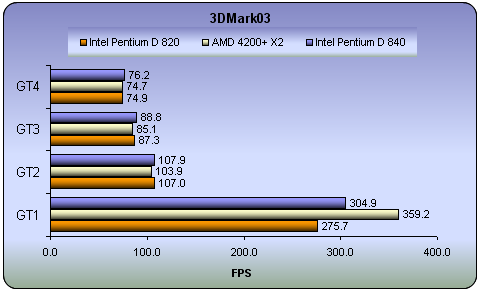
This benchmark tests the performance with DirectX games. From the results in the CPU score test, we see that the processing power of the AMD 4200+ is much higher. Generally though, the reported fps for games is more dependent on the Graphic Card. And so in all cases with the games tests, we had similar performance for all processors, except in the case of the GT1 game where the AMD was way ahead.
7. 3DMark2005
3DMark05 is focused on measuring the performance of the DirectX 9 generation of 3D hardware using the technology of next generation games. Earlier 3DMark versions had usually been launched with the introduction of each new Microsoft DirectX version which was in turn based on each new hardware generation. This had somewhat limited how much 3DMark was able to utilize any new hardware features. At the time of this writing, DirectX 9 is already two years old, and there is now DX9 generation hardware available which allows 3DMark05 to fully utilize the features of the hardware. In fact, DirectX 9 hardware is required for every game test in 3DMark05, resulting in the ultimate tool for DirectX 9 hardware performance comparison.
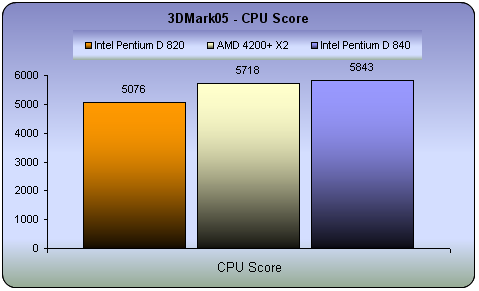
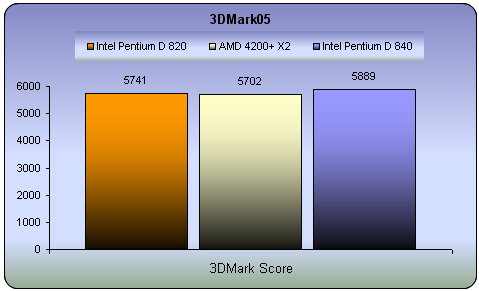
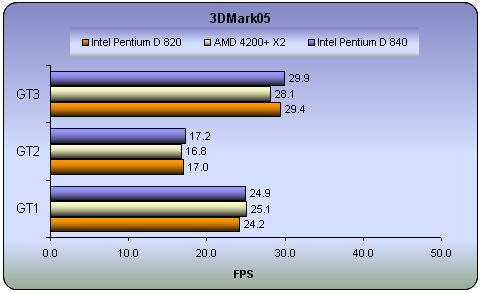
In the 3DMark05 tests, it seems that the D 840 outperforms slightly, the AMD 4200+.
8. Performance Test v5.0
CPU Benchmarks
The PassMark Performance Test suite contains multi-process CPU tests such as:
- Integer (32-bit addition, subtraction, multiplication and division)
- Floating Point (32-bit addition, subtraction, multiplication and division)
- WIN32: MMX (matrix multiplication) or WIN64: 64bit Integer Matrix Multiplication
- WIN32: SSE (128-bit SSE operations such as addition, subtraction and multiplication) or WIN64: 64bit Floating Point Matrix operations
- WIN32: 3Dnow! (3D transformation of an array of 32-bit vertices) or WIN64: 64bit Floating Point Matrix operations
- Compression
- Encryption
- Image Rotation (Rotate image co-ordinates in memory)
- Random String Sorting
Integers are whole numbers (i.e. no fractional part) such as 23, 459532, -26. Floating point numbers contain a fractional part, e.g. 1.003, 98394.2. These two types of numbers are treated quite differently inside a computer, which is why PerformanceTest differentiates between the two.
For each of the integer tests, a large array of random 32 bit integers is processed using the particular mathematical operations listed below. For the floating point tests, single precision floating point numbers (32 bit) are used.
The "PassMark rating" is a weighted average of all the other test results and gives a single overall indication of the computer's performance. The bigger the number, the faster the computer. The "PassMark rating" can only be calculated if the results from all other tests are available. The value is calculated as follows.
| Test Suite |
Weighting |
| Disk |
20% |
| CD / DVD |
9% |
| Memory |
18% |
| 3D Graphics |
12% |
| 2D Graphics |
14% |
| CPU |
27% |
| Total |
100% |
In our case however, we only ran the CPU suite.
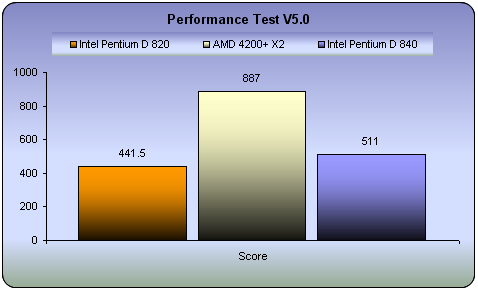
First, we chose to perform "All" tests for the CPU. Below you can see the results for each of the three processors.
| Test |
D 820 |
4200+ X2 |
D 840 |
 |
 |
 |
 |
Extremely good performance from the AMD processor outscoring its iNTEL rivals in every case.
Multitasking Benchmarks
The Advanced Multi Process Test in the PassMark benchmark is designed to run a series of standard benchmark tests in parallel, to examine the performance under these conditions. Multiple processor machines should excel under this kind of environment, as the load is split between the various CPUs.
The tests include a number of the standard PassMark benchmarks along with some popular benchmarking algorithms and tests which emulate some day-to-day operations your CPU may be required to carry out which are particularly processor intensive.
As the tests are quite varied, as are their results, it unfortunately means that no graphing feature exists as is common amongst the other Advanced Tests.
| Test Name |
D 820 |
4200+ X2 |
D 840 |
Primes found |
| Prime Number Search |
68342 |
67617 |
74187 |
Primes Found |
| Sorting Random Strings |
153891 |
236453 |
164435 |
Thousand strings sorted per second |
| Compression |
357 |
421 |
411 |
KBytes per second |
| Encryption |
2082.46 |
2059.46 |
2393.44 |
KBytes per second |
| Rotation |
38.16 |
27.22 |
43.26 |
Rotation per second |
| MMX Addition |
107.96 |
152.77 |
117.67 |
Million Ops/Sec |
| MMX Multiplication |
101.69 |
155.26 |
110.39 |
Million Ops/Sec |
| Integer addition |
126.35 |
108.17 |
145.24 |
Million Ops/Sec |
| Whetstone |
226.23 |
448.10 |
256.10 |
Million Ops/Sec |
| Dhrystone |
341.23 |
508.23 |
443.45 |
Million Ops/Sec |
More details about each test below:
The Tests
- Prime Number Search:
This test uses a simple brute force prime number finding algorithm. It begins at 3 and checks every integer to see if it is a member of the set of primes. (A prime number is one which is divisible only by 1 and itself). The test reports the amount of primes found and the largest prime. Note that for longer test periods, the rate of Primes Per Second found will drop as the distance between primes gets larger.
- Sorting Random Strings:
The test uses qsort to continually sort 1000 strings of 256 characters. Once the test duration expires, the test reports the speed of the sorting in thousands of strings per second.
- Compression:
The Compression test uses an Adaptive encoding algorithm based on source code from Ian H. Witten, Radford M. Neal, and John G. Cleary in an article called “Arithmetic Coding for Data Compression”. The system uses a model which maintains the probability of each symbol being the next encoded. It reports a compression rate of 363% for English text, which is slightly better than the Huffman method. This test reports its results in KBytes/Sec compressed.
- Encryption:
The encryption test uses the Blowfish enciphering algorithm. It is based on the C implementation by Paul Kocher. Data is enciphered using a 16byte key in blocks of 4 KB. The test reports in KBytes/Sec.
- Rotation:
The rotation algorithm is a PassMark developed algorithm using standard rotation mathematics. The test uses a 400 x 400 pseudo image with one byte of data per pixel. The image is rotated degree by degree, with each degree counting as one rotation. The test reports in rotations per second.
- MMX Addition:
- MMX Multiplication:
These are the standard PassMark benchmarks. See MMX Tests for more information. These tests are only included with the version of PT that is for the 32-bit version of Windows.
- Maths Integer addition:
This is a standard PassMark benchmark. See Maths Tests for more information.
- Whetstone:
The Whetstone benchmark is one commonly used to test floating point arithmetic. The algorithm is based on the original C source code written by Rich Painter. The benchmark is designed to test the speed of commonly used floating point CPU instructions. The test reports in MIPS (Million Instructions Per Second.)
- Dhrystone:
The Dhrystone benchmark is one commonly used to test a machines integer arithmetic. The algorithm is based on the C source code for Dhrystone version 2 by Reinhold P. Weicker. The test reports in MIPS.
- Memory Read:
- Memory Write:
These are the standard PassMark benchmarks. See Memory Tests for more information.
- Disk Access:
This test uses the same test engine as the PassMark Advanced Disk Test. The test uses a file size of the current available RAM, a block size of 4K, the Win32 uncached interface, a 50%/50% RW level, it is 100% Sequential and executed in Synchronous mode. The test reports its results in MB/Sec.
9. Prime95
Prime95 is basically a Mersenne prime number discovery program. It's a great example of Distributed Computing, but it's most loved by overclockers for its powerful system stress-testing and benchmarking abilities. It can torture-test your CPU to produce its maximum heat or spit out any errors due to excessive overclocking. Also, using the blend test, it can consume all your physical memory and run error-checking tests on your modules to ensure their quality. However, right now, we're mostly interested in it for its benchmarking capabilities.
Here are the times (in milliseconds) for the Intel D 840, AMD 4200+ and Intel D 820 (less is better).
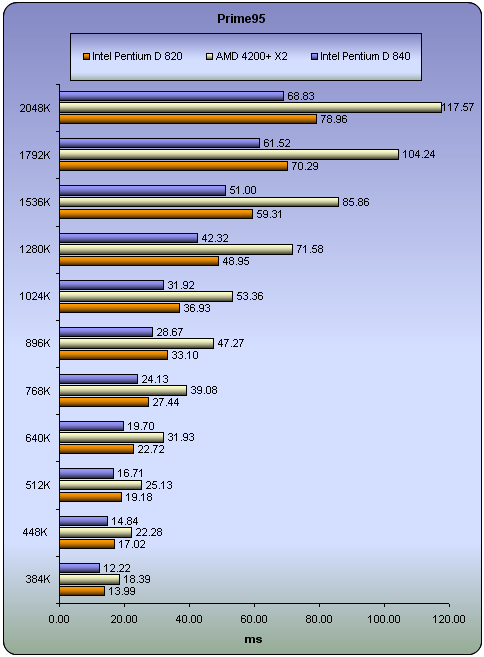
The D 840 reported the fastest times while the AMD was rather slow.
10. Encoding
Benchmarks are good for reference and comparisons, but what about real life performance? For this reason, we carried out some simple tests, using popular utilities that most users run every day.
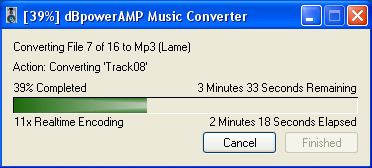
dBPower Tests
In the following graph, you can see how the three CPUs performed while encoding the same audio file into different formats. For this process, we used a whole music CD with a size of 750MB. We ripped the AudioCD using EAC and then with dBPower, encoded from one format to another. The times needed for each task are given below ( the lower the better off course :-).
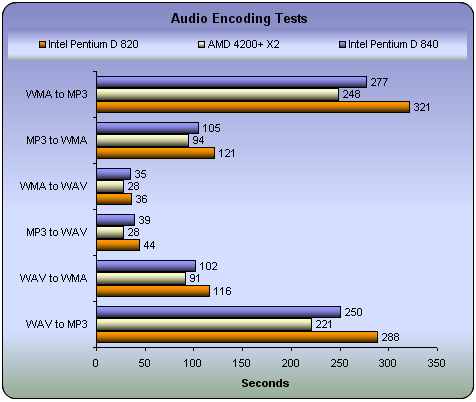
In audio encoding, it seems that the AMD is much faster than its Intel counterparts.
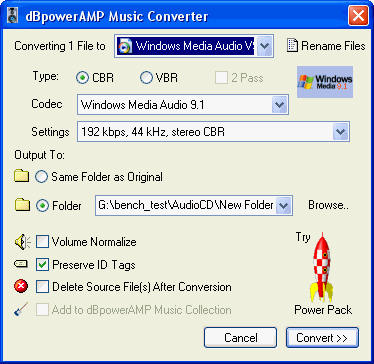
The settings for dBPower were the same for all CPUs. Analytically:

DVD Shrink Tests
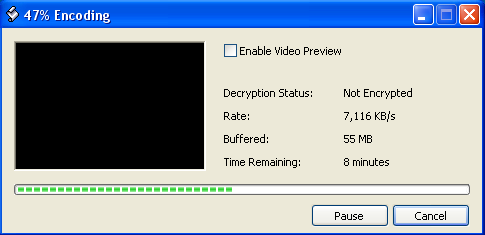
Compressing a movie from DVD9 to DVD5 is a very common task. For this task, we ripped an original movie (which we own off course :-), using DVD Decrypter. Then, with DVD Shrink, we compressed it in order to fit on a DVD5 disc. The size of the original movie was 6.85GB which was compressed to 4.463GB. Below you can see how many frames per second each CPU processed and the total time needed for the encoding.
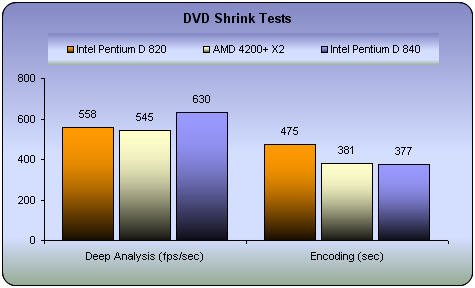
The D 840 handled more frames per second than the AMD but their encoding time is almost the same.
DivX Tests
Another very common task is to convert a movie into the DivX format. For this, we used a .vob file sized 202MB which was converted to .avi with FlaskMPEG. The settings are listed below:
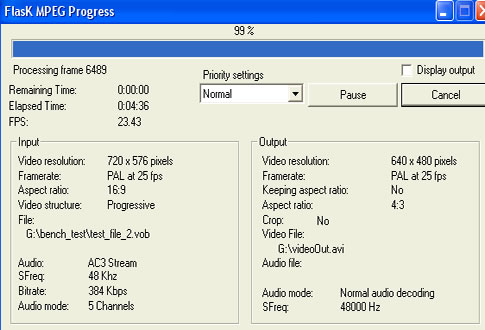

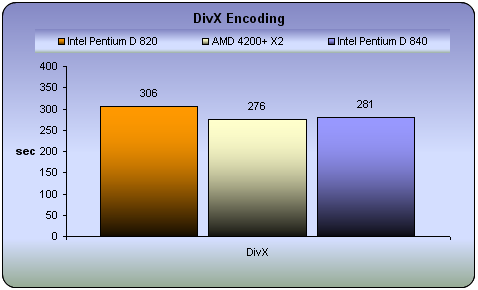
In DivX encoding, the AMD 4200+ was slightly faster than the D 840.
WinRAR Tests
Using a folder with 101MB of various data, we checked how long each of the CPUs needed to compress and extract the entire folder.

In file compression, our simple test reports that the 4200+ is faster than either the D 820 or D 840, while in decompression the D 840 was faster by 2 seconds.
11. Half Life 2
Half life 2 is undoubtedly the most anticipated pc game of all times.
 Physics - From pebbles to water to 2-ton trucks respond as expected, as they obey the laws of mass, friction, gravity, and buoyancy.
Graphics - Source's shader-based renderer, like the one used at Pixar to create movies such as Toy Story® and Monster's, Inc.®, creates the most beautiful and realistic environments ever seen in a video game.
AI - Neither friends nor enemies charge blindly into the fray. They can assess threats, navigate tricky terrain, and fashion weapons from whatever is at hand.
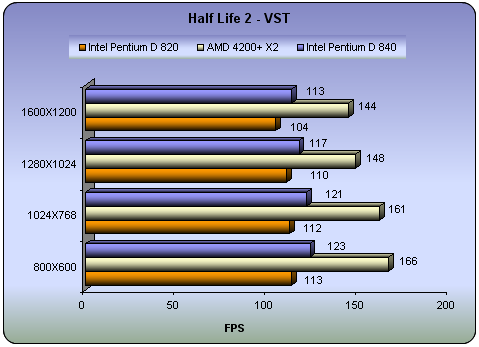
There is no doubt that AMD processors lead the race when it comes to games. 30~40fps higher performance than with the Intel D 820 or D 840.
12. Overclocking
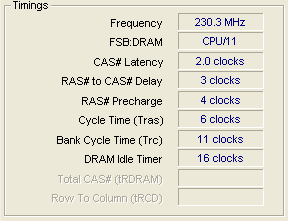
We didn't try to push the AMD 4200+ to its limits this time and we chose a "safer" overclocking profile. We set the FSB to 230 instead of the default 200, without changing the multiplier. The Core Speed was increased from 2.2GHz up to 2.53GHz. Although this might not seem impressive, let us see what the difference in performance will be.
- The Tests
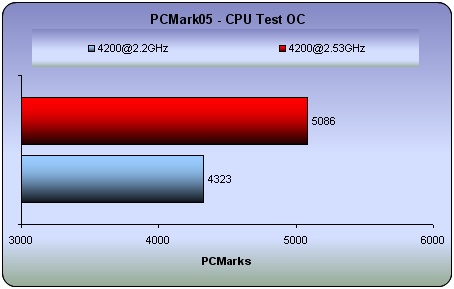
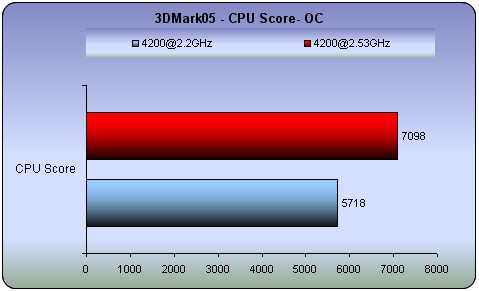
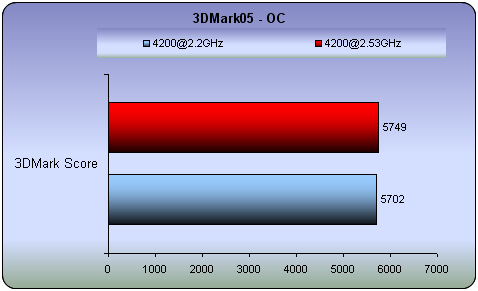
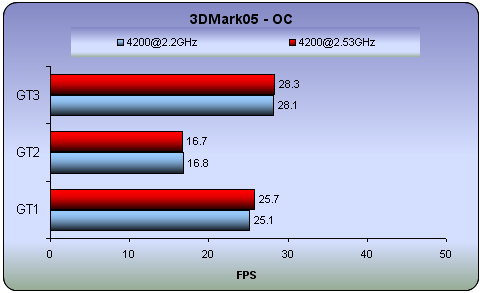
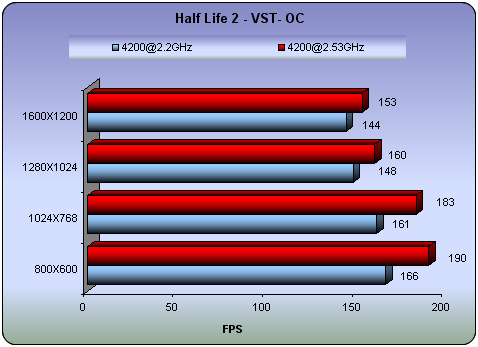
The increase in CPU performance is more than satisfactory, while the overall performance with games is excellent. Approximately 25fps at low resolutions and close to 10fps at high.
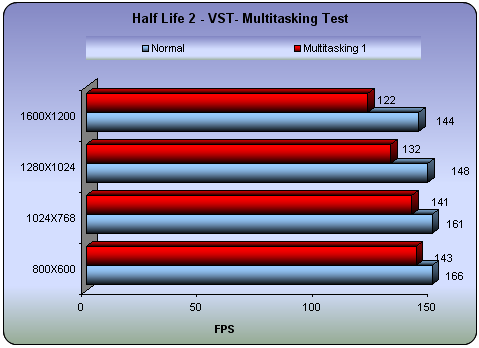
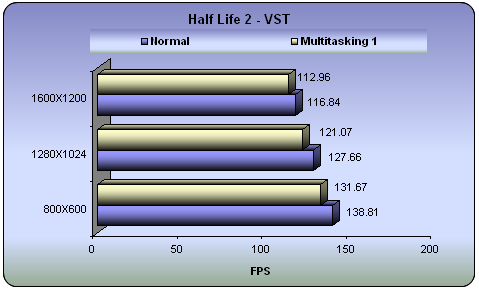
13. Multitasking
At this point, it would be rather interesting to see how the AMD 4200 performs in some tasks while there are others running in the background. For example, if you are an extreme gamer but you also want to download from the internet, how will this affect the actual frame rate and by how much? How about encoding a movie while listening to music? We will try to answer these kinds of questions with our simple tests that follow.
We are pretty sure that if we ran several tasks at the same time, the AMD 4200 will eventually reach its limits. But the most important thing is to cover as many everyday needs with the most common tasks. For this reason, we selected the following combinations of tasks.
Our first attempt was to measure the framerate in HL2 while in the background, we ran DVD Shrink, encoding in low priority mode. DVD Shrink was reading from the Primary HD while it was writing to an external burner. The games were installed on the Primary HD.
AMD 4200+ X2
Intel D 840
As you can see, the framerate is not greatly affected and you are still be able to play your favorite games while converting your movies. As it was reasonable to expect, DVD Shrink encoding time was almost doubled, from 6:21 min to 12:40 min. In comparison to the D 840 the respective times were 6:17min in single mode and 10:10min while running HL2. In both cases framerates were decreased while the encoding time was increased. The Intel seems to handle better the encoding process but in games the framerates are much lower than in case of the AMD. However if we check the percentage differences of the D 840 and the 4200+ we will find that the Intel has a lower decrease in performance than the AMD.
Our second experiment involved encoding with DVD Shrink and at the same time converting 16 wav files to MP3. Each task separately needed 6:21 min for the encoding with DVD Shrink and 3:41min for converting the 16 wav files (a full AudioCD of 700MB), to MP3 with dBpower. When we then ran both tasks simultaneously, the times required changed to 12:11min and 3:43min for DVD Shrink and dBpower respectively. Since dBpower finished earlier, we repeated the audio conversion so as to have both tasks running at the same time.
If we do some simple maths, we can see that with the AMD processor for example, performing each task in series would require 6:21 mins for DVD Shrink and 11:03 mins (3x3:41 mins) for dBPower which makes a total of 17:24 mins. If we now look at the times when both applications are run simultaneously, the three runs with dBPower required 11:09 mins (3x3:43) and DVD Shrink 12:11 mins. Hence, the effective time is the maximum of the two which is 12:11 mins. In this case, it is better to run the tasks simultaneously instead of separately, in series.
| |
DVD Shrink (min) |
dBPower (min) |
| Single (min) |
Multi (min) |
difference |
Single (min) |
Multi (min) |
difference |
| 4200+ |
6:21 |
12:11 |
48% |
3:41 |
3:43 |
1% |
| D 840 |
6:17 |
11:46 |
46% |
4:10 |
4:36 |
10% |
| D 820 |
7:55 |
15:06 |
48% |
4:48 |
4:58 |
3% |
In the case of audio conversion, the AMD retains the same times as when the task was running alone. The D 840 increased the audio conversion time by 10%. We also notice that all CPUs double the time required by DVD Shrink when processing dBPower's audio conversion simultaneously. To investigate what is going on here, we ran Window's task manager and looked at how the two cores are utilized when each of our two applications is run separately.

dBPower CPU and memory usage graphs
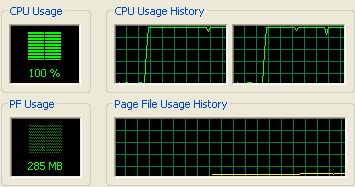
DVD Shrink CPU and memory usage graphs
What we notice is that with dBPower, the majority of the load is handled by one of the two cores although that core, never reaches 100%. The other core's load is a complement of the first and if we were to add the two together, we would roughly have the equivalent of a single CPU core working at 100%. The DVD Shrink graph shows both cores working at 100%. This explains why DVD Shrink doubled the time required in our tables previously, when dBPower is running at the same time.
14. Conclusion
The overall performance of the AMD 4200+ X2 is very good. In most tests, it reported high performance while in many cases, it outperformed Intel's D 840. With the PCMark2004 and 2005 benchmarks, we saw that the D 840 is better in multitasking with specific tasks, such as File Encryption or File Decryption, while in others the AMD is faster (File Compression/Decompression, Audio Compression). 3DMark2001 and 2003 give a better score to the AMD 4200+ X2 while the 3DMark2005 reported a higher score for the D 840.
While all these benchmarks are good and provide a controlled testbench with which to gauge overall performance as well as provide comparisons with other systems, we believe real life tests under actual conditions, with common, everyday tasks such as Audio and Video Encoding, in many cases can provide a clearer picture that most of us can relate to. The AMD 4200+ X2 is much faster in Audio Conversion while in Video Encoding (DVDShrink) it reported similar performance to the D 840, although the D 840 can handle more frames per second (Deep Analysis). There was similar performance for both the 4200+ and D 840 in DivX encoding, with the 4200+ being only slightly faster. In Data compression with WinRAR, the AMD processor is faster while in extraction, similar times with the D 840. In games, there is no doubt that the AMD 4200+ has the great advantage. 30~40fps higher performance than the Intel D 820/840.
In multitasking, the performance, according to our scenarios, was similar for all the processors. However, overall the AMD appears to be better since it retains its low times. Better with games and Audio Conversion, negligible percentage difference in comparison to the D 840 in Video encoding.
Overclocking with the 4200+ is easy. We chose a "safe" overclocking profile by setting the FSB to 230 from the default 200, without changing the multiplier. The Core Speed increased from 2.2GHz up to 2.53GHz. The difference in performance was more than satisfactory in all tasks we tried. Even in games, we got 25fps more at low resolutions while in high, close to 10fps.
A very strong advantage of the AMD 4200+ X2 is its low operating temperature. 21°C in idle state while under the Prime95 stress test, just 28°C. The very efficient cooling system from Thermaltake helped with this, but if we compare it to the temperatures that our AMD 3500 reported (29°C to 39°C), with the same cooling system, we can conclude that the temperature levels of the 4200+ are fantastic. Such low temperature levels are no comparison for the Intel D series, where the levels are almost twice as high.
Price is always a major factor of which processor is the best buy. At the time of this review, the prices were US$239 for the D 820, US$400 for the 4200+ and US$539 for the D 840. The cost of the D 820 excuses its lower performance and it is indeed the cheapest Dual Core processor currently. On the other hand, the D 840 is too expensive and its performance was not overall, better than that of the 4200+. So, if you need a powerful processor at a reasonable price, then the AMD 4200+ X2 may be just the thing.