1. Introduction
 In 2002, Serial ATA (SATA) was introduced as the next step in ATA technology. SATA provides greater scalability, simpler installation, thinner cabling and faster performance (up to 3.0 GB/s). SATA also maintains backward compatibility with Parallel ATA drivers.The entire desktop market has started moving towards the SATA interface from the more traditional Parallel ATA interface.
The term SATA II has grown in popularity as the moniker for the SATA 3Gb/s data transfer rate, causing great confusion with customers because, quite simply, it’s a misnomer.
The first step toward a better understanding of SATA is to know that SATA II is not the brand name for SATA’s 3Gb/s data transfer rate, but the name of the organization formed to author the SATA specifications. The group has since changed names, to the Serial ATA International Organization, or SATA-IO.
The 3Gb/s capability is just one of many defined by the former SATA II committee, but because it is among the most prominent features, 3Gb/s has become synonymous with SATA II. Hence, the source of the confusion.
The foregoing is taken from the sata-io.org web site (Naming Guidelines).
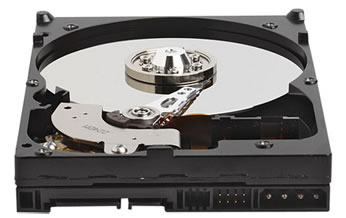
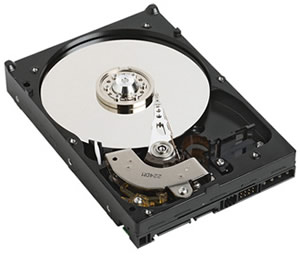
In this review, we are going to compare the performance of a SATA II HDD with a SATA 1.0 HDD. For our tests, we used two Western Digital Hard Discs, the WD2500JS (SATA II) and the WD3000JD (SATA).

 |
| the two Western Digital HDDs we used... |
- Specifications
| Performance Specifications |
| Model |
WD2500JS (SATA II) |
WD3000JD (SATA) |
| Rotational Speed |
7,200 RPM (nominal) |
| Buffer Size |
8 MB |
| Average Latency |
4.20 ms (nominal) |
| Seek Times |
| Read Seek Time |
8.9 ms |
| Track-To-Track Seek Time |
2.0 ms (average) |
| Full Stroke Seek |
21.0 ms (average) |
| Transfer Rates |
| Buffer To Host (Serial ATA) |
300 MB/s (Max) |
150 MB/s (Max) |
| Buffer To Disk |
748 Mbits/s (Max) |
| Physical Specifications |
| Formatted Capacity |
250,059 MB |
300,069 MB |
| Capacity |
250 GB |
300 GB |
| Interface |
SATA 300 MB/s |
SATA 150 MB/s |
| Bytes Per Sector |
512 |
| User Sectors Per Drive |
488,397,168 |
586,072,368 |
| Servo Type |
Embedded |
| Physical Dimensions |
| Height |
26.1 mm (Max) |
| Length |
147 mm (Max) |
| Width |
101.6 mm |
| Weight |
0.6 kg (+/- .082 kg) |
0.73 kg (+/- .082 kg) |
| Environmental Specifications |
| Shock |
| Operating Shock (Read) |
65G, 2 ms |
| Non-operating Shock |
350G, 2 ms |
250G, 2 ms |
| Acoustics |
| Idle Mode |
26 dBA (average) |
28 dBA (average) |
| Seek Mode 0 |
31 dBA (average) |
33 dBA (average) |
| Seek Mode 3 |
27 dBA (average) |
29 dBA (average) |
| Temperature |
| Operating |
5° C to 55° C |
| Non-operating |
-40° C to 65° C |
| Humidity |
| Operating |
5-95% RH non-condensing |
| Non-operating |
5-95% RH non-condensing |
| Altitude |
| Operating |
-305M to 3,050M |
| Non-operating |
-305M to 12,200M |
| Vibration |
| Operating |
| Linear |
20-300 Hz, .75G (0 to peak) |
| Random |
10-300 Hz, 0.004 g² / Hz |
| Non-operating |
| Low Frequency |
5-20 Hz, 0.195 inches (double amplitude) |
| High Frequency |
20-500 Hz, 4.0G (0 to peak) |
10-300 Hz, 5.0G (0 to peak) |
| Electrical Specifications |
| 12 VDC |
| Read/Write |
450 mA |
510 mA |
| Idle |
430 mA |
510 mA |
| Standby |
20 mA |
20.5 mA |
| Sleep |
20 mA |
20.5 mA |
| 5 VDC |
| Read/Write |
800 mA |
575 mA |
| Idle |
730 mA |
550 mA |
| Standby |
270 mA |
200 mA |
| Sleep |
250 mA |
200 mA |
| Power Dissipation |
| Read/Write |
9.50 Watts |
| Idle |
8.75 Watts |
| Standby |
1.60 Watts |
1.20 Watts |
| Sleep |
1.50 Watts |
1.20 Watts |
Now that we have covered the specifications, let's move on to the HDTach
tests and their respective results...
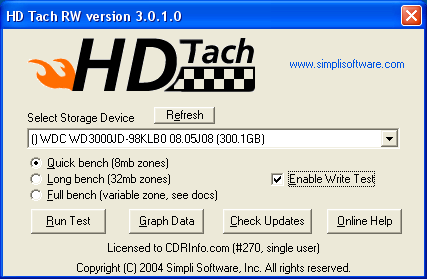
2. HD Tach
In order to test and gauge the performance of SATA II, we compared it with SATA 1.0. Both discs were Western Digital, connected to the motherboard's SATA.
HD Tach tests the sequential read, random access and interface burst speeds of your attached storage device (hard drive, flash drive, removable drive, etc). All drive technologies such as SCSI, IDE/ATA, 1394, USB, SATA and RAID are supported. Test results from HD Tach can be used to confirm manufacturer specs, analyze systems for proper performance and compare your performance with others.
This benchmark is intended to determine the maximum read or write speed on the device at various locations. Hard drives, for example, have faster read/write speeds at the inside edge (mapped to block 0) of the device, so it is useful to see the difference in speed. The maximum sustained speed (lowest speed on the device) is an important metric for real time sequential access applications. The maximum speed may be important to a power user that would like to partition the drive into a high speed partition and low speed partition.


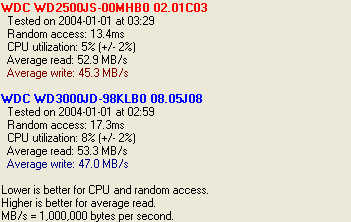
Shown in red above, is the WD2500JS (SATA II).
Alternatively in blue, we have the performance of the WD3000JD (SATA).
As we can see from the graph, performance with the WD2500JS is slightly better, starting off with a sequential read speed of 63MB/s and tapering off to around 35MB/s towards the end. While performance with the WD3000JD started at 53MB/s and maintained the transfer rate at around 35MB/s toward the end.
In the overall averages, for reading tests, the WD2500JS reported 52.9MB/s and the WD3000JD 53.3MB/s, whilst in writing, 45.3MB/s and 47.0MB/s respectively. The difference between them isn't significant and this difference is due to the different supported transfer rates (300MB/s for the WDC WD 2500JS and 150MB/s for the WDC WD 3000JD).
3. SiSoftware Sandra 2005
 SiSoftware Sandra is a 32 and 64-bit Windows system analyser that includes benchmarking, testing and listing modules. It tries to go beyond other utilities to show you more of what is really going on under the hood so you draw comparisons at both a high and low-level in a single product.
You can get information about the CPU, chipset, video adapter, ports, printers, sound card, memory, network, Windows internals, AGP, ODBC Connections, USB2, Firewire etc. You can save/print/fax/e-mail/post/upload or insert into ADO/ODBC databases reports in text, HTML, XML, SMS/DMI or RPT format.
This version supports multiple sources of information gathering including: remote computers, PDAs, Smart Phones, ADO/ODBC databases or saved system reports. All benchmarks are optimised for both SMP & SMT (Hyper-Threading), up to 32/64 CPUs depending on the platform.
File system Benchmark
- The "File system Benchmark" tests how your drive(s) and controller(s) compare to other devices in a typical system:
· Read Test: Buffered, Random, Sequential
· Write Test: Buffered, Random, Sequential
· Seek Test
The "Drive Index" mark is a composite figure representing an overall performance rating based on the average of the read, write, and seek tests, and file and cache size. The Drive Index is intended to represent drive performance under typical use in a PC. A larger number means better performance. The weighting of the results is not equal and represents the distribution of different files sizes as used on these devices (obtained through field research).
| File system Benchmark |
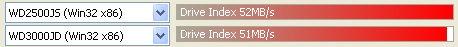 |
The WD2500JS (SATA II) has a higher, by only 1MB/s, Drive Index.
Removable Storage/Flash Benchmark
- The "Compact Flash" typical usage model for these devices is File operations, such as Writing a file to the device, reading a file from it, and deleting a file. This benchmark exercises the devices in terms of these operations (to measure the “raw” cluster level performance of the device, it is recommended to also test it by means of the File System Benchmark module). The following characteristics are measured for each of the four representative file sizes of 512 Bytes (representing a minimal single data cluster file), 32kB, 256kB and 2MB. The weighting of the results is not equal and it represents the distribution of different files sizes as used on these devices (obtained through field research). For each of the four file sizes, a Combined Index is then calculated, stating the combined performance in terms of Combined Operations Per Second, with respect to a mix of write, read and delete operations.
- Combined Device Index: is a composite figure representing an overall performance rating based on the average of the Combined Index figures over the four file sizes. (Higher is better, i.e. better performance)
- Endurance Factor: is a figure representing the Wear and Life Expectancy of flash devices; this is obtained by dividing the average performance (normal condition, i.e. sequential write) to the lowest performance (high-stress condition, i.e. same block re-write). It measures the relative improvement of endurance caused by the wear leveling or flash management algorithm; the absolute endurance of a device (i.e. its expected life-time) is directly dependent, in addition to this Endurance Factor, on the nominal manufacturer rating of maximum erase/reprogram cycles, which is typically 100,000+ for SLC and 10,000+ for MLC devices. (Higher is better, i.e. longer life-time for the device)
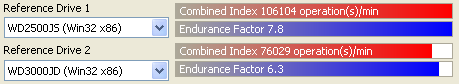
In this benchmark, the WD2500JS reported better overall performance, while endurance also seems to be a little bit better than the WD3000JD.
4. PCMark05
PCMark05 is an application-based benchmarks and a premium tool for measuring overall PC performance. It uses portions of real applications instead of including very large applications or using specifically created code. This allows PCMark05 to be a smaller installation as well as to report very accurate results. As far as possible, PCMark05 uses public domain applications whose source code can be freely examined by any user.
PCMark05 includes 4 categorized suites for benchmarking your computer. These include CPU, Graphics, Memory and a Hard Disk Drive benchmark. In our case, we selected only the Hard Disk Drive benchmark.
As expected, the WD2500JS SATA II earned the most PCMarks, although the WD3000JD isn't that far behind.

The test results, more analytically:
| HDD Test Suite |
WD2500JS (SATA II) |
WD3000JD (SATA) |
| XP Startup (MB/sec) |
9.781 |
8.628 |
| Application Loading (MB/sec) |
8.064 |
7.255 |
| General Usage (MB/sec) |
6.349 |
5.692 |
| Virus Scan (MB/sec) |
74.975 |
66.888 |
| File Write (MB/sec) |
57.737 |
57.201 |
Now let's move on to the last page and the conclusion of the SATA II vs SATA 1.0 review.
5. Conclusion

Serial ATA is beginning to make its impact on computers; SATA drives are quickly taking over from the traditional Parallel ATA drives. A quite important fact is that SATA and SATA II are trying to bring business-class hard drive performance to non-SCSI machines.
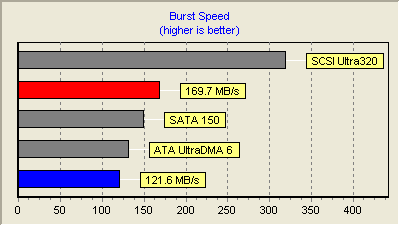
As we went though the tests, we noticed that our SATA II HDD was slightly faster than the SATA 1.0 HDD. In the HDTach test, the WD2500JS SATA II reported 196.7 MB/s in burst speed, while the WD3000JD SATA reported 121.6 MB/s. In the SiSoftware Sandra tests, there weren't any significant differences, with the exception of the combined index where the WD2500JS reported higher values. In PCMark05, the differences were more or less around 1 MB/sec in all tests.
At the time of the review, the price of the WD2500JS SATA II was US$95, while for the WD2500JD SATA, US$86 and $121.50 for the WD3000JD.
(Prices from pricegrabber.com).
So, is it worth investing in a SATA II HDD? Well, according to the above prices for the WD2500JS and WD2500JD, the answer could be yes, if 250GB is enough for your needs, since you can pay a little more and purchase the WD3000JD with 300GB, with few differences in performance. Also, keep in mind that currently, there isn't a SATA II HDD with a capacity larger than 250GB.