1. Introduction
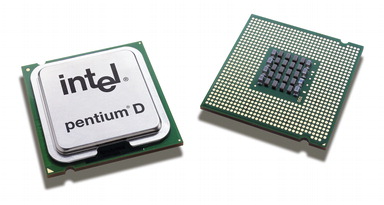
 Although Intel manufactures a wide range of products, it is best known for its processors. And certainly, anyone who has used a computer has heard of Intel. So we'll skip the preliminaries and shoot straight into the review. :-) Some time back, we had reviewed the Intel D 840 Dual Core processor. This time we're going to be looking at the Intel D 820, Dual Core processor running at 2.8GHz with 1MB L2 cache for each core. The D 820 is the smallest of the D series and as is to be expected, also the most affordable solution in Dual Core.
Specifications
| Architecture |
90 nm technology |
| L2 Cache |
2x1MB |
| Clock Speed |
2.80 GHz |
| Front Side Bus |
800 MHz |
| Chipset |
- Intel 955X Express chipset
- Intel 945P Express chipset
- Intel 945G Express chipset
- Intel E7230 Chipset |
| Socket |
LGA775 |
Features
- Dual-Core: Provides two execution cores in one physical processor allowing the platform to
do more in less time while enjoying smooth interaction with your PC.
- Enhanced Intel® SpeedStep® Technology: Available with
the 840 and 830 processors, Enhanced Intel Speedstep
Technology allows the system to dynamically adjust processor
voltage and core frequency, which can result in decreased
average power consumption and decreased average heat
production. By decreasing power and heat on Desktop PCs,
system builders can (depending on system configurations)
potentially lower acoustics, and even develop more innovative
small form factor designs. Additionally, this feature may help
address power concerns in companies with sites approaching
the limits of bounded electrical infrastructures. Combined with
existing power saving features, Enhanced Intel SpeedStep
technology may provide an excellent balance between providing
power when you need it and conserving it when you don’t.
- Execute Disable Bit: This feature, combined with a
supported operating system, allows memory to be marked
as executable or non-executable. If code attempts to run in
non-executable memory the processor raises an error to the
operating system.
- Intel® Extended Memory 64 Technology: Intel EM64T provides an enhancement to
Intel’s 32-bit architecture by enabling the desktop processor
platform to access larger amounts of memory. With appropriate
64-bit supporting hardware and software, platforms
based on an Intel processor supporting Intel EM64T can enable
use of extended virtual and physical memory.
- 90nm Process Technology: The 90nm process
technology is the latest in Intel manufacturing and
technology leadership allowing for next generation
transistor advantages, such as strained silicon lattice to
deliver faster transistors and potentially increased performance.
- Level 1 Cache: The Pentium D processor features two
16KB data caches. In addition to the data cache, each core
includes an Execution Trace Cache that stores up to 12 K
decoded micro-ops in the order of program execution. This
can increase performance by removing the decoder from the
main execution loop and makes more efficient usage of the
cache storage space since instructions that are branched
around are not stored.
- 2MB Level 2 Cache: The Intel Pentium D processor
based upon Intel 90nm process technology has a 1MB L2
Advanced Transfer Cache for each core (2MB total) improving
overall system performance by allowing each processor core
to have faster access to larger amounts of the most often
used data.
- Streaming SIMD Extensions 3 (SSE3): Single Instruction
Multiple Data Extensions significantly accelerates performance
of digital media applications and includes additional
integer and cache ability instructions that may improve other
aspects of performance.
Processor Features & Definitions |
| Architecture |
Basic design of a microprocessor. May include process technology and/or other architectural enhancements. |
| Cache
(MB/KB) |
A temporary storage area for frequently accessed or recently accessed data. Having certain data stored in a cache speeds up the operation of the computer. Cache size is measured in megabytes (MB) or kilobytes (KB). |
| Clock Speed
(GHz/MHz) |
Speed of the processor's internal clock, which dictates how fast the processor can process data. Clock speed is usually measured in GHz (gigahertz, or billions of pulses per second). |
| Front Side Bus
(GHz/MHz) |
The connecting path between the processor and other key components such as the memory controller hub. FSB speed is measured in GHz or MHz. |
The stock cooler that Intel includes in its retail version for the D 820 is similar to that of the D 840 but with some major differences from that of the P4 series, which however are not noticeable on first sight. If you look carefully at the two photos below, you'll see that the copper base that is common to all Intel stock coolers, is a little larger and fuller in the case of D series. The fins are also of a different design.
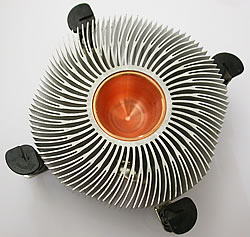 |
| Old cooler |
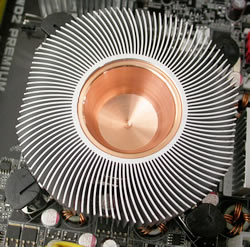 |
| New Cooler |
We'll now move onto the benchmark tests, to see what sort of performance the "junior" member of the Dual Core processors from Intel has to offer when compared to the D840 and the P4 650. The P4 650 and the D 820 have similar prices, with the D 820 slightly cheaper, so it will be rather interesting to see which one performs best, the Dual Core or the Single Core?
2. Specifications
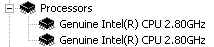
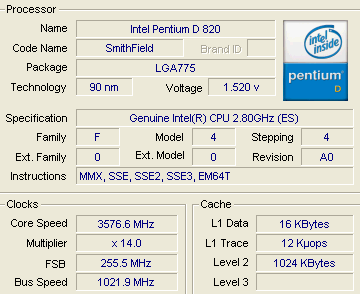
In Device Manager, you'll notice that the D 820 is identified as two processors, while with CPU-Z you can read the details for each one separately.
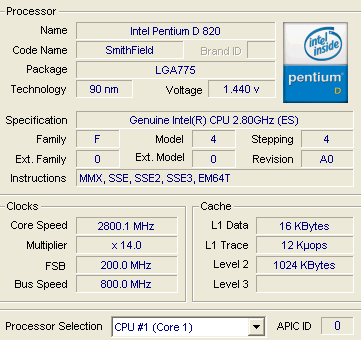
The FSB runs at 200MHz while the Bus speed at 800MHz. The multiplier is set by default to 14.
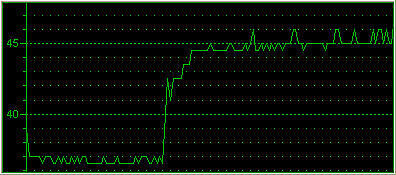
The temperature levels for the D 820 are not too far from those of a P4. In idle, the temperature is close to 41°C while under full load, it reaches 57°C. This is much lower than it was in the case of the D 840 which started at 54°C and under full load, we saw go over 70 °C.
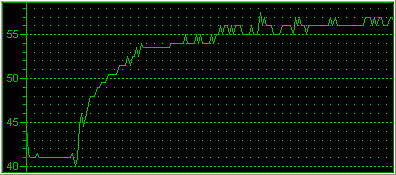
If you decide to go for a more efficient cooling system, such as the Arctic-Cooling Freezer 7 PRO or the Thermaltake BlueOrb II, the temperature levels will be greatly reduced.
Here's a rundown of our test bed, used to test the Intel D 820 2.80GHz processor:
System Specifications:
CPU: Intel Pentium D 820
Cooler: stock, Arctic-Cooling Freezer 7 PRO, Thermaltake BlueOrb II
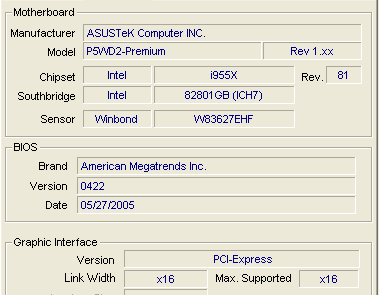
Motherboard: Asus P5WD2E-Deluxe
Power supply: Thermaltake PurePower 520W
Memory: 2X512MB Corsair CM2X512-8000UL (dual channel)
VGA: AOPEN 6800Ultra
Hard Disk Drive: WD800JD 80GB 7200RPM
OS: Windows XP Pro SP2
Drivers: 77.77
DirectX: v9.0
Benchmarks & Applications used
- Sisoft Sandra 2005
- Prime95
- PcMark04
- 3DMark01
- 3DMark03
- 3DMark05
- PassMark Performance Test V5.0
- Half Life 2 - VST
- Asus Probe 2.23
- FlaskMPEG
- DVD Shrink
- dBPower
- WinRAR
- CPU-Z
3. SiSoftware Sandra
SiSoftware Sandra is a 32 and 64-bit Windows system analyser that includes benchmarking, testing and listing modules. It also provides information on the CPU, chipset, video adapter, ports, printers, sound card, memory, network, Windows internals, AGP, ODBC Connections, USB2, Firewire, etc.
The CPU Arithmetic benchmark:
Multi-Processor (SMP) support for up to 32/64 CPUs & SMT.
- Test takes about 20/30 seconds on P6-class PCs
- Test is repeated 3 to 5 times to get a realistic result
- Results outside the confidence limits (5%) are discarded
- Command Line Switch: CPUAABench
- Requirements: None
- OS (Win32) Support: Windows 2000, XP, 2003
- OS (Win32 CE) Support: PocketPC 2000/2002/2003, SmartPhone 2002, 2003
- OS (Win64) Support: Windows XP/2003
Sandra's CPU arithmetic benchmark suite uses 2 famous benchmarks (Dhrystone and Whetstone) for stress testing the processor. It also includes a new version of the Whetstone test that makes use of a processor's SSE2 instructions to show the performance boost an application might gain should it be optimized for SSE2. Unfortunately, this does not always represent true real-life performance, but is useful for comparing the speed of various CPUs.
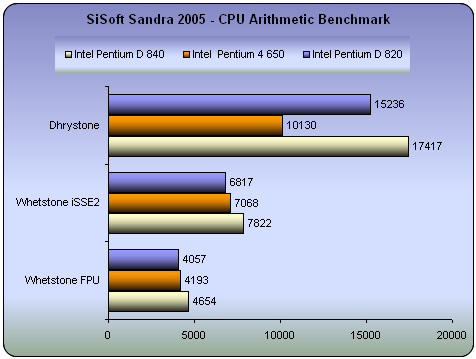
In all cases, the D 840 seems to be the best of the three with the D 820 not far behind. In the Dhrystone test, the P4 650 is falls way behind.
The CPU Multi-Media benchmark:
- Multi-Processor (SMP) support for up to 32/64 CPUs & SMT.
- Test takes about 20 seconds on P6-class PCs.
- Test is repeated 3 to 5 times to get a realistic result.
- Results outside the confidence limits (5%) are discarded.
- Command Line Switch: CPUMMBench
- Requirements: MMX (Enhanced), 3DNow! (Enhanced) or SSE(2/3) recommended
- OS (Win32) Support: Windows 2000, XP, 2003
- OS (Win64) Support: Windows XP/2003
The test has two parts:
Integer test - using integer data:
- MP SSE3 is used for better performance if supported.
- MP SSE2 is used for better performance if supported.
- MP SSE (Streaming SIMD) is used for better performance if supported.
- MP Enhanced MMX is used for better performance if supported.
- MP MMX is used for better performance if supported.
- MP ALU is used otherwise.
Floating-point test - using floating point data:
- MP SSE3 is used for better performance if supported.
- MP SSE2 is used for better performance if supported.
- MP SSE (Streaming SIMD) is used for better performance if supported.
- MP 3DNow! Enhanced is used for better performance if supported.
- MP 3DNow! is used for better performance if supported.
- MP FPU is used is used otherwise.
This test involves the generation of Mandelbrot Set fractals that are used to realistically describe and generate natural objects such as mountains or clouds. By using various multi-media extensions (MMX), 3DNow! and SSE(2/3) better performance is achieved.
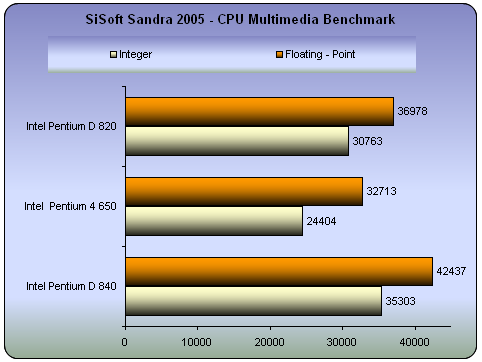
Once again, the D 840 is the fastest, as is expected, but the D 820 is not that far beyond while the P4 650 again trails.
4. PCMark04 - 05
PCMark04 and 2005 are application-based benchmarks and a premium tool for measuring overall PC performance. They use portions of real applications instead of including very large applications or using specifically created code. This allows them to be smaller installations as well as to report very accurate results. As far as possible, PCMark04 and 2005 use public domain applications whose source code can be freely examined by any user.
Both PCMark04 and PCMark05 include 4 categorized suites for benchmarking your computer. These include CPU, Graphics, Memory and a Hard Disk Drive benchmark. In our case, we selected only the CPU test suite.
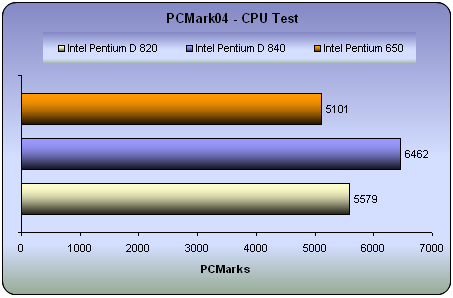
Once more, the D 840 leads the race while the D 820 once again outperformed the 650. If you take a look at the following table and comparing the D 820 with the P 650, you'll see that the D 820 performed better in most of the tasks, even though they are all single thread processes. In the File Decryption, Audio Conversion and DivX Video Compression tests, the P4 650 was faster.
The test results, more analytically:
| |
D 820 |
D 840 |
P4 650 |
| File Compression (MB/sec) |
6.0 |
6.9 |
4.8 |
| File Encryption (MB/sec) |
80.4 |
92.3 |
63.4 |
| File Decompression (MB/sec) |
55.5 |
64.0 |
41.0 |
| Image Processing (MPixels/sec) |
23.8 |
27.6 |
16.7 |
| Grammar Check (KB/sec) |
4.1 |
4.8 |
4.0 |
| File Decryption (MB/sec) |
79.9 |
91.9 |
97.7 |
| Audio Conversion (KB/sec) |
2183.0 |
2508.0 |
2665.0 |
| WMV Video Compression (FPS) |
63.6 |
75.8 |
59.1 |
| DivX Video Compression (FPS) |
76.8 |
88.0 |
78.1 |
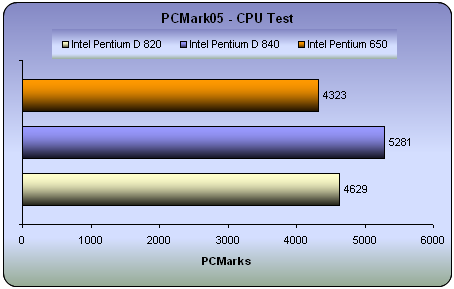
While the overall test scores shown in the graph above don't show it, the analytical table below reveals a slightly different story with PCM05, probably because the tests are more recent than the previous PCMark04 and include benchmarks that test the processors with multithreading. According to the analytical results with PCM05, both the D 820 and D 840 had worse performance than the P4 650 in the single threaded tests, while in the case of multithreading, much better. Notice here how multithreading with single core and dual core affects the performance in each task. For example, File Compression and File Encryption hardly change from single-thread to multithread with the D 820, whereas with the P4 650, there is a substantial drop in performance. The same happens when the processes are more than two, where the Dual Core processors demonstrates their power.
| |
D 820 |
D 840 |
P4 650 |
| File Compression (MB/sec) |
7.276 |
8.090 |
8.782 |
| File Decompression (MB/sec) |
110.438 |
128.221 |
134.073 |
| File Encryption (MB/sec) |
63.862 |
73.528 |
77.649 |
| File Decryption (MB/sec) |
61.808 |
70.689 |
75.161 |
| Image Decompression (MPixels/sec) |
22.633 |
25.991 |
27.593 |
| Audio Compression (KB/sec) |
1835.877 |
2117.081 |
2228.157 |
| Multithreaded Test 1 |
| File Compression (MB/sec) |
7.270 |
8.012 |
6.297 |
| File Encryption (MB/sec) |
63.504 |
73.385 |
39.149 |
| Multithreaded Test 2 |
| File Decompression (MB/sec) |
55.681 |
63.249 |
40.032 |
| File Decryption (MB/sec) |
30.634 |
35.716 |
19.971 |
| Audio Decompression (KB/sec) |
888.453 |
1003.015 |
669.745 |
| Image Decompression (MPixels/sec) |
11.363 |
12.895 |
8.256 |
5. 3DMark2001
3DMark2001 SE is a diagnostics tool for measuring the 3D game performance of PCs. It is entertaining and easy to use, which makes it "must have" software for all home PC users interested in 3D games. Even a beginner PC user can get a game performance measurement with 3DMark2001 SE.
Although the 3DMark series is more dedicated to 3D graphics performance, it is rather interesting to see how a faster CPU helps the VGA to achieve higher FPS.
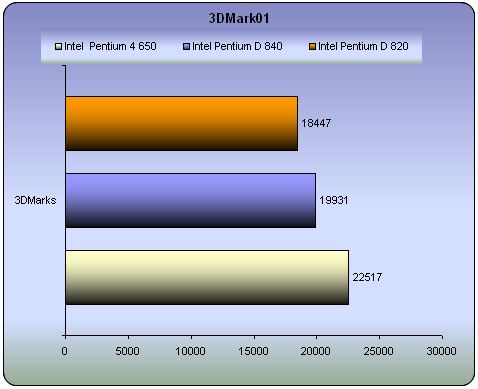
We saw that in case of multithreading, the D 840 and D 820 outperformed the P4 650. In 3DMark01 however, the P4 650 turns the tables on both dual core processors and by a sizeable difference.
6. 3DMark2003
3DMark is a widely used and accepted benchmark that stresses the DirectX performance of a VGA card. For testing the performance of each card we use the 4 game benchmark 3DMark offers. The first is a DirectX 7 game, the second and the third use DirectX 8 and the last one stresses graphics in DirectX 9. A very strong point of 3DMark is that its VGA card measuring does not require a lot of CPU power. So the resulting fps are a good reference of a VGA card's rendering performance.
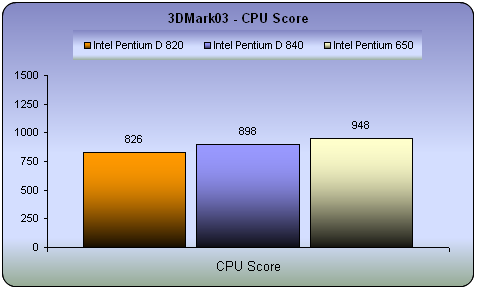
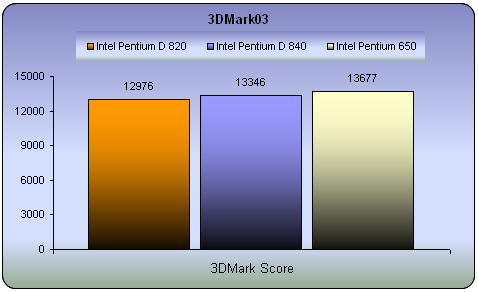
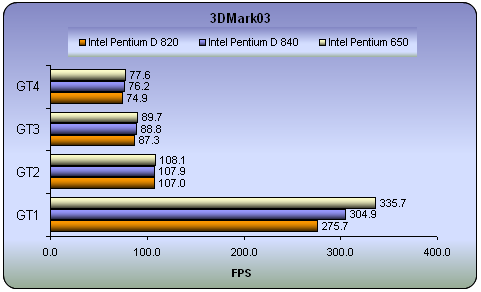
This benchmark tests the performance with DirectX games. Here too, the P4 650 showed better performance, reporting higher frame rates than the D 820 and D 840. The difference in most cases is negligible, but in the last, with DirectX9, the P4 650 reported a much higher framerate.
7. 3DMark2005
3DMark05 is focused on measuring the performance of the DirectX 9 generation of 3D hardware using the technology of next generation games. Earlier 3DMark versions had usually been launched with the introduction of each new Microsoft DirectX version which was in turn based on each new hardware generation. This had somewhat limited how much 3DMark was able to utilize any new hardware features. At the time of this writing, DirectX 9 is already two years old, and there is now DX9 generation hardware available which allows 3DMark05 to fully utilize the features of the hardware. In fact, DirectX 9 hardware is required for every game test in 3DMark05, resulting in the ultimate tool for DirectX 9 hardware performance comparison.
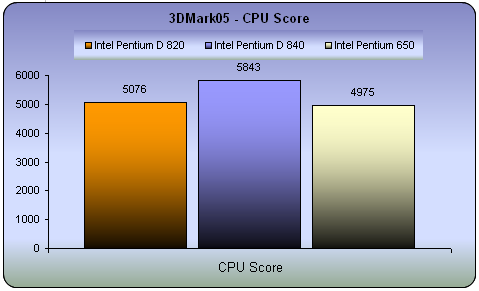
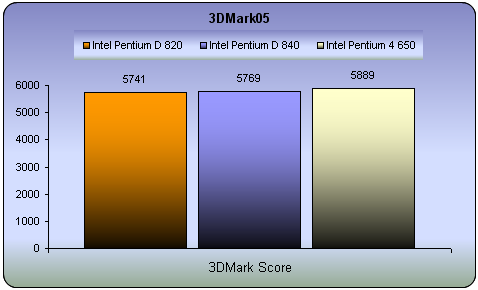
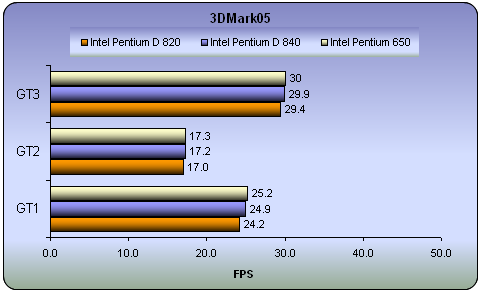
The highest CPU score goes to the D 840 while the highest framerates, to the P4 650 but the difference between all three processors is negligible.
8. Performance Test
CPU Benchmarks
The PassMark Performance Test suite contains multi-process CPU tests such as:
- Integer (32-bit addition, subtraction, multiplication and division)
- Floating Point (32-bit addition, subtraction, multiplication and division)
- WIN32: MMX (matrix multiplication) or WIN64: 64bit Integer Matrix Multiplication
- WIN32: SSE (128-bit SSE operations such as addition, subtraction and multiplication) or WIN64: 64bit Floating Point Matrix operations
- WIN32: 3Dnow! (3D transformation of an array of 32-bit vertices) or WIN64: 64bit Floating Point Matrix operations
- Compression
- Encryption
- Image Rotation (Rotate image co-ordinates in memory)
- Random String Sorting
Integers are whole numbers such as 23, 459532, -26. Floating point numbers contain a fractional part, e.g. 1.003, 98394.2. These two types of numbers are treated quite differently inside a computer, which is why PerformanceTest differentiates between the two.
For each of the integer tests, a large array of random 32 bit integers is processed using the particular mathematical operations listed below. For the floating point tests, single precision floating point numbers (32 bit) are used.
The "PassMark rating" is a weighted average of all the other test results and gives a single overall indication of the computers performance. The bigger the number, the faster the computer. The "PassMark rating" can only be calculated if the results from all other tests are available. The value is calculated as follows.
| Test Suite |
Weighting |
| Disk |
20% |
| CD / DVD |
9% |
| Memory |
18% |
| 3D Graphics |
12% |
| 2D Graphics |
14% |
| CPU |
27% |
| Total |
100% |
In our case however, we only ran the CPU suite.
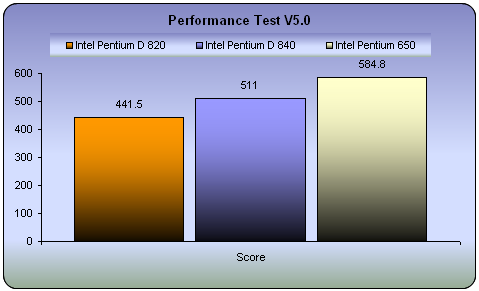
First we chose to perform "All" tests for the CPU. Below you can see the results for the three processors.
The P4 650 won hands down in each and every test.
Multitasking Benchmarks
The Advanced Multi Process Test in the PassMark benchmark is designed to run a series of standard benchmark tests in parallel, to examine the performance under these conditions. Multiple processor machines should excel under this kind of environment, as the load is split between the various CPUs.
The tests include a number of the standard PassMark benchmarks along with some popular benchmarking algorithms and tests which emulate some day-to-day operations your CPU may be required to carry out which are particularly processor intensive.
As the tests are quite varied, as are their results, it unfortunately means that no graphing feature exists as is common amongst the other Advanced Tests.
| Test Name |
D 820 |
D 840 |
P4 650 |
Primes found |
| Prime Number Search |
68342 |
74187 |
57306 |
Primes Found |
| Sorting Random Strings |
153891 |
164435 |
173887 |
Thousand strings sorted per second |
| Compression |
357 |
411 |
298 |
KBytes per second |
| Encryption |
2082.46 |
2393.44 |
1612.63 |
KBytes per second |
| Rotation |
38.16 |
43.26 |
26.17 |
Rotation per second |
| MMX Addition |
107.96 |
117.67
|
54.05 |
Million Ops/Sec |
| MMX Multiplication |
101.69 |
110.39 |
57.83 |
Million Ops/Sec |
| Integer addition |
126.35 |
145.24 |
87.50 |
Million Ops/Sec |
| Whetstone |
226.23 |
256.10 |
260.47 |
Million Ops/Sec |
| Dhrystone |
341.23 |
443.45 |
301.36 |
Million Ops/Sec |
Apart from the Random String Sorting and Whetstone test, the dual-core processors excelled in these multitasking benchmarks.
More details about each test below:
The Tests
- Prime Number Search:
This test uses a simple brute force prime number finding algorithm. It begins at 3 and checks every integer to see if it is a member of the set of primes. (A prime number is one which is divisible only by 1 and itself). The test reports the amount of primes found and the largest prime. Note that for longer test periods, the rate of Primes Per Second found will drop as the distance between primes gets larger.
- Sorting Random Strings:
The test uses qsort to continually sort 1000 strings of 256 characters. Once the test duration expires, the test reports the speed of the sorting in thousands of strings per second.
- Compression:
The Compression test uses an Adaptive encoding algorithm based on source code from Ian H. Witten, Radford M. Neal, and John G. Cleary in an article called “Arithmetic Coding for Data Compression”. The system uses a model which maintains the probability of each symbol being the next encoded. It reports a compression rate of 363% for English text, which is slightly better than the Huffman method. This test reports its results in KBytes/Sec compressed.
- Encryption:
The encryption test uses the Blowfish enciphering algorithm. It is based on the C implementation by Paul Kocher. Data is enciphered using a 16byte key in blocks of 4 KB. The test reports in KBytes/Sec.
- Rotation:
The rotation algorithm is a PassMark developed algorithm using standard rotation mathematics. The test uses a 400 x 400 pseudo image with one byte of data per pixel. The image is rotated degree by degree, with each degree counting as one rotation. The test reports in rotations per second.
- MMX Addition:
- MMX Multiplication:
These are the standard PassMark benchmarks. See MMX Tests for more information. These tests are only included with the version of PT that is for the 32-bit version of Windows.
- Maths Integer addition:
This is a standard PassMark benchmark. See Maths Tests for more information.
- Whetstone:
The Whetstone benchmark is one commonly used to test floating point arithmetic. The algorithm is based on the original C source code written by Rich Painter. The benchmark is designed to test the speed of commonly used floating point CPU instructions. The test reports in MIPS (Million Instructions Per Second.)
- Dhrystone:
The Dhrystone benchmark is one commonly used to test a machines integer arithmetic. The algorithm is based on the C source code for Dhrystone version 2 by Reinhold P. Weicker. The test reports in MIPS.
- Memory Read:
- Memory Write:
These are the standard PassMark benchmarks. See Memory Tests for more information.
- Disk Access:
This test uses the same test engine as the PassMark Advanced Disk Test. The test uses a file size of the current available RAM, a block size of 4K, the Win32 uncached interface, a 50%/50% RW level, it is 100% Sequential and executed in Synchronous mode. The test reports its results in MB/Sec.
9. Prime95
Prime95 is basically a Mersenne prime number discovery program. It's a great example of Distributed Computing, but it's most loved by overclockers for its powerful system stress-testing and benchmarking abilities. It can torture-test your CPU to produce its maximum heat or spit out any errors due to excessive overclocking. Also, using the blend test, it can consume all your physical memory and run error-checking tests on your modules to ensure their quality. However, right now, we're mostly interested in it for its benchmarking capabilities.
Here are the times for the Intel D 840, D 820 and P4 650 (less is better).
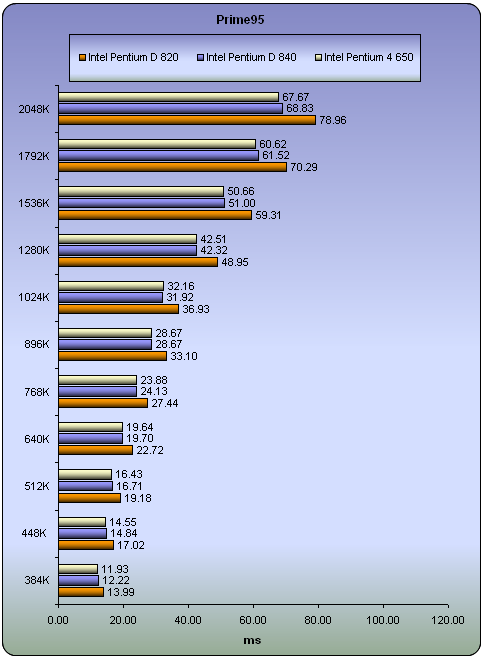
The P4 650 reported the lowest times with the D 840 very close behind.
10. Encoding
Benchmarks are good for reference and comparison reasons but what about real life performance? For this reason, we carried out some simple tests, using popular utilities that most users run every day.
dBPower Tests
In the following graph, you can see how the three CPUs performed while encoding the same audio file into different formats. For this process, we used a whole music CD with a size of 750MB. We ripped the AudioCD using EAC and then with dBPower, encoded from one format to another. The times needed for each task are given below ( the lower the better off course :-).
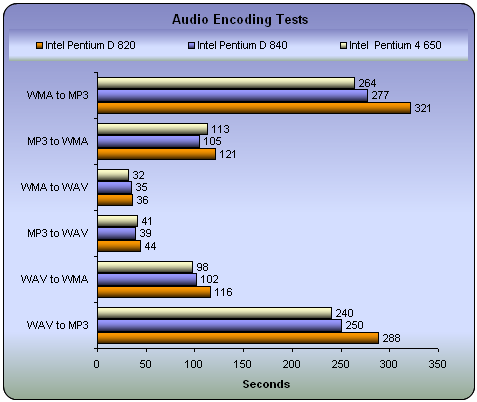
Audio encoding with the D 820 is not as good as expected. In all tests, the reported times were high. The P4 650 on the other hand was much faster in this task. The major differences occurred when converting WMA to MP3 and WAV to MP3, where the difference was almost a minute.
The settings for dBPower were the same for all CPUs. Analytically:

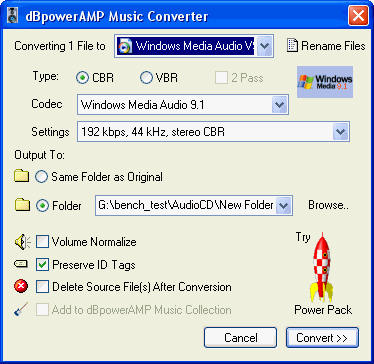
DVD Shrink Tests
Compressing a movie from DVD9 to DVD5 is a very common task. For this reason, we ripped an original movie (which we own off course :-), using DVD Decrypter. Then, with DVD Shrink, we compressed it in order to fit on a DVD5 disc. The size of the original movie was 6.85GB and we compressed it to 4.463GB. Below you can see how many frames per second each CPU processed and the total time needed for the encoding.
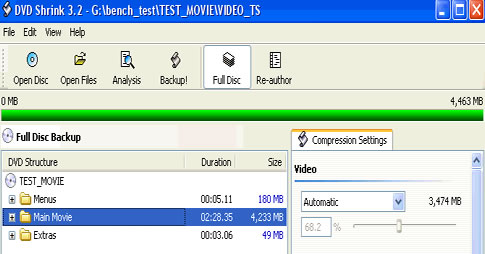
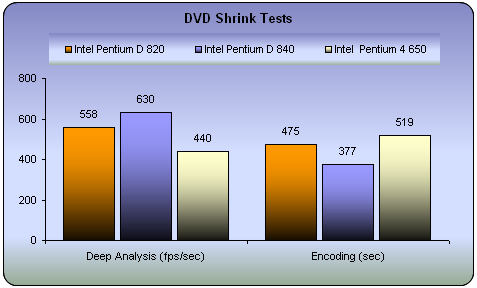
The D 820 handled more frames per second than the P4 650 during Deep Analysis, but required 50 seconds more during the encoding phase.
DivX Tests
Another very common task is to convert a movie into the DivX format. For this, we used a .vob file sized 202MB which was converted to .avi with FlaskMPEG. The settings are listed below:
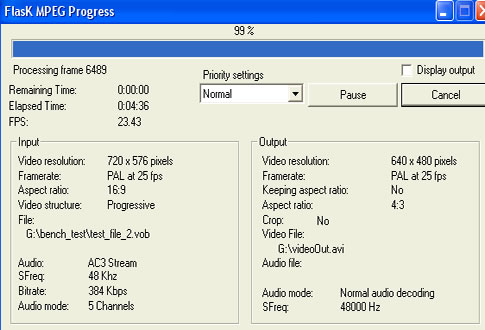

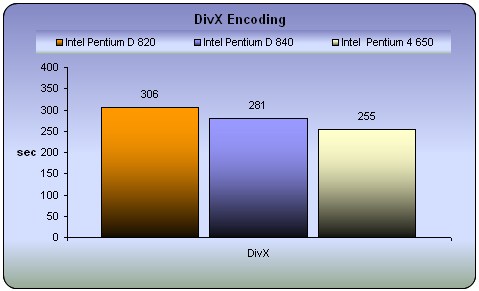
In DivX encoding, the P4 650 proved faster than the D820.
WinRAR Tests
Using a folder with 101MB of various data, we checked how long each of the CPUs needed to compress and extract the entire folder.

Much longer times required by the D 820 in comparison to the P4 650, which had similar performance with the D 840.
11. Games
Half life 2 is no doubt the most anticipated pc game of all times.
 Physics - From pebbles to water to 2-ton trucks respond as expected, as they obey the laws of mass, friction, gravity, and buoyancy.
Graphics - Source's shader-based renderer, like the one used at Pixar to create movies such as Toy Story® and Monster's, Inc.®, creates the most beautiful and realistic environments ever seen in a video game.
AI - Neither friends nor enemies charge blindly into the fray. They can assess threats, navigate tricky terrain, and fashion weapons from whatever is at hand.
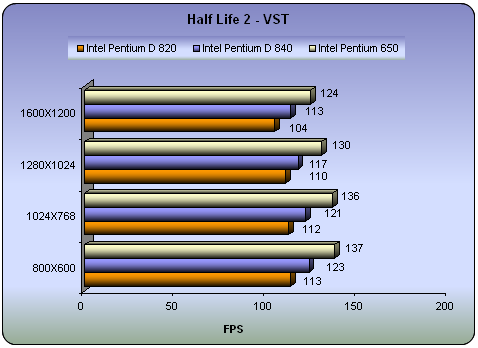
The performance in an actual game enviroment as reported in our tests, is much better in the case of the P4 650 than with the Dual Core D 820. The difference, no matter what the resolution, was more than 20fps in all cases.

A massive demonic invasion has overwhelmed the Union Aerospace Corporations’ (UAC) Mars Research Facility leaving only chaos and horror in its wake. As one of the few survivors, you struggle with shock and fear as you fight your way to Hell and back, in an epic clash against pure evil.
Activision made it's miracle again with Doom 3 which is said to be the best-looking game ever, thanks to the brand-new OpenGL graphics engine used to generate its convincingly lifelike, densely atmospheric, and surprisingly expansive environments. If you are a fan of the previous Doom games then you will get many flashbacks with this revision, since you will find reimagined versions of almost every monster from both Doom and Doom II.

To measure performance on the game, we used the timedemo demo1 command from the console (Alt+Ctrl+~).
Enabling the high quality setting and executing the timedemo demo1 command twice for each resolution, we witnessed the following:
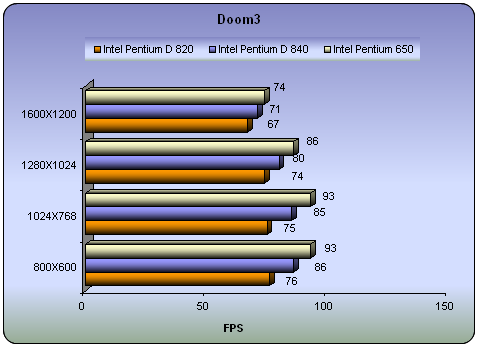
Still better performance with the P4 650, but not as great a difference this time.
If you are a gamer, the P4 650 is much more suitable for you.
12. Overclocking
In order to overclock the CPU, we manually started step by step to increase the FSB, beginning from the default 200. The multiplier is set by default at 14.
We finally reached 255 MHz for the FSB, where we were able to access Windows and work without problems. We then ran PCMark05 and SiSoft Sandra 2005 in order to check the stability of the processor. We had also tried with a higher FSB, at 260 MHz, but there were problems running PCMark05.
With the FSB set at 255 MHz, the Core speed went up to 3.57GHz.
- The Tests
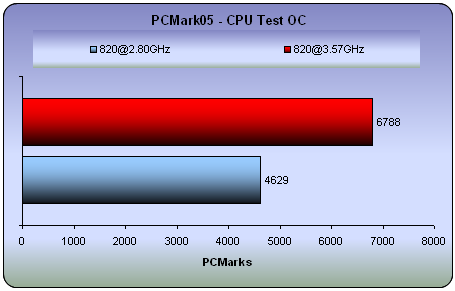

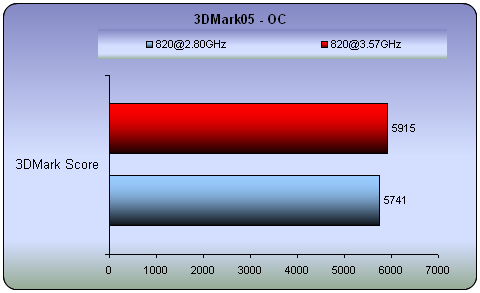
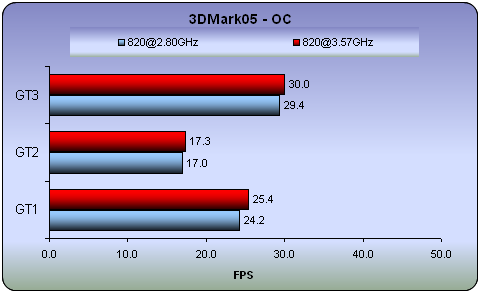
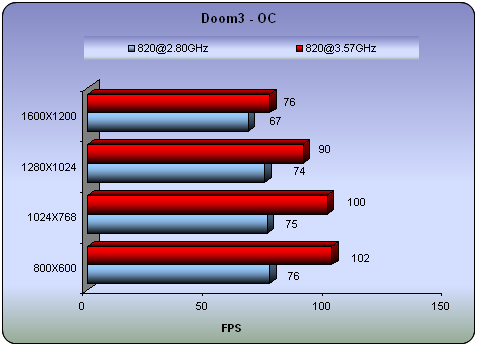
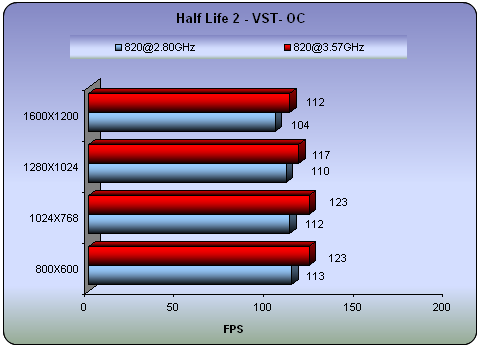
By overclocking your D 820, you gain something in all tasks. Even in games, the actual increase in framerate was quite substantial. Note that we overclocked the processor only for testing purposes. You should realise that such an action can damage your CPU or make its life expectancy shorter. Do it at your own risk.
13. Multitasking
At this point, it would be rather interesting to see how the D 820 performs in some tasks while there are others running in the background. For example, if you are an extreme gamer but you also want to download from the internet, how will this affect the actual frame rate and by how much? How about encoding a movie while listening to music? We will try to answer these kinds of questions with our simple tests that follow.
We are pretty sure that if we ran several tasks at the same time, the D 820 will eventually reaches its limits. But the most important thing is to cover everybody's needs with the most common tasks. For this reason, we selected the following combinations of tasks.
Our first attempt was to measuring the framerate in HL2 while in the background, we ran DVD Shrink, encoding in low priority mode. DVD Shrink was reading from the Primary HD while it was writing to an external burner. The games were installed on the Primary HD.
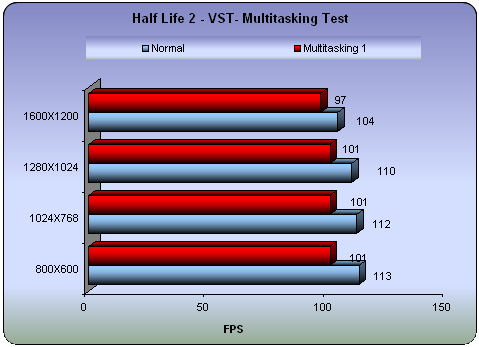
As you can see, the framerate is not greatly affected and you are still be able to play your favorite games while converting your movies. As it was reasonable to expect, DVD Shrink encoding time was almost doubled, from 7:55 min to 15:16 min. Framerates were decreased. Performance from the D 820 is good, but if you set the resolution at a high rate and enable advanced filtering, then it is possible that you might notice some difference while playing.
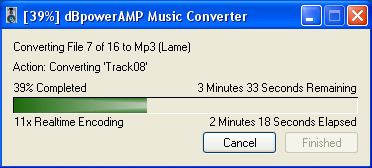
Our second experiment involved encoding with DVD Shrink and at the same time converting 16 wav files to MP3. Each task separately needed 7:55 min for the encoding with DVD Shrink and 4:48min for converting the 16 wav files (a full AudioCD of 700MB), to MP3 with dBpower. When we then ran these two tasks simultaneously, the times required changed to 15:06min and 4:58min for DVD Shrink and dBpower respectively. Since dBpower finished earlier, we kept repeating the audio conversion so as to have both tasks running at the same time.
The performance of the D 820 under multitasking is quite satisfactory, although we did expect something better. If you really need more processing power, then you'll have to go for the D 840, but it also costs double the price of the D 820...
14. Conclusion
Overall performance with the D 820 is good. In most tests, it reported better performance than the P4 650. These were mainly CPU benchmark tests with SiSoft Sandra, PCMark05 or Prime95. But in games, the P4 650 reported higher framerates. However, if you are planning to use the processor for multi-processing, then the D 820 will serve you much better than the P4 650, as we saw in the PCM05 multitasking benchmarks.
One good thing with the D 820, is the lower temperature levels in comparison with the D 840. These were not too far from a P4. In idle, the temperature is close to 41°C while under full load, it reached 57°C. This is much lower than in the case of the D 840 which started at 54°C and under full load, climbed to over 70 °C.
Overclocking the D 820 is quite easy. Without any great effort, we set the CPU to run from the default 2.80GHz up to 3.57GHz. The gain in performance is significant and even greater in game environments, where you can gain anywhere from 10fps to 25fps, depending on the resolution and filtering settings.
The D 820 costs approximately US$258 on the e-market, while the P4 650, US$275, and was one of the main reasons we decided to pit the two processors in a head to head. The price for the D 840 at the same time, was close to US$537. So if you are about to get a new processor for your system and you don't know whether to go for single or dual core, then the answer depends on what exactly you are planning to do. Do you just want to play mostly games, or do you need good, overall performance running lots of processes? In the first case, the P4 650 is a definite winner while in the second, the D 820.