1. Introduction

 In our previous review featuring Intel's products, we had compared the P4 660 3.6Ghz with the AMD 3800+ and whether it was worth upgrading your system from a P4 530 3.0Ghz to one of these two 64bit CPUs. This time round, we are back with the P4 3.73Ghz Extreme Edition.
The Intel Pentium 4 3.73Ghz Extreme Edition is different from the other 5xx and 6xx series. The L2 cache is 2MB, as in the 6xx series, but the Front Side Bus (FSB) is at 1066Mhz. The only chipsets that supports this CPU are the 955X Express and the 925XE Express. Below are some other feature of the P4 ED:
- Execute Disable Bit : Can improve protection against malicious "buffer overflow" attacks when properly enabled with a supporting operating system.
- EM64T : Intel Extended Memory 64 Technology (or Intel EM64T), is an enhancement to Intel's IA-32 architecture. The enhancement allows the processor to run newly written 64-bit code and access larger amounts of memory.
- NetBurst micro-architecture : The NetBurst micro-architecture delivers a number of new and innovative features including Hyper Pipelined Technology, 400 MHz System Bus, Execution Trace Cache, and Rapid Execution Engine. It also delivers a number of enhanced features, including Advanced Transfer Cache, Advanced Dynamic Execution, Enhanced Floating Point and Multimedia Unit, and Streaming SIMD Extensions 2.
- 2MB L2 Cache : A larger cache size can help the processor more efficiently run many popular applications in digital imaging, music, video and gaming.
- 90nm process technology : This 90-nm process combines higher-performance, lower-power transistors,
strained silicon, high-speed copper interconnects and a new low-k dielectric
material.
Processor Features & Definitions |
| Architecture |
Basic design of a microprocessor. May include process technology and/or other architectural enhancements. |
Cache
(MB/KB) |
A temporary storage area for frequently accessed or recently accessed data. Having certain data stored in a cache speeds up the operation of the computer. Cache size is measured in megabytes (MB) or kilobytes (KB). |
Clock Speed
(GHz/MHz) |
Speed of the processor's internal clock, which dictates how fast the processor can process data. Clock speed is usually measured in GHz (gigahertz, or billions of pulses per second). |
Front Side Bus
(GHz/MHz) |
The connecting path between the processor and other key components such as the memory controller hub. FSB speed is measured in GHz or MHz. |
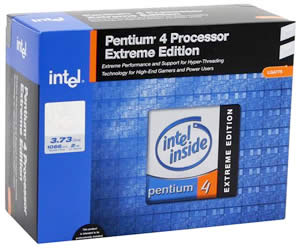
The test sample we received from Intel was for evaluation purposes only and not a production processor. That's the reason for the "CONFIDENTIAL" marking.
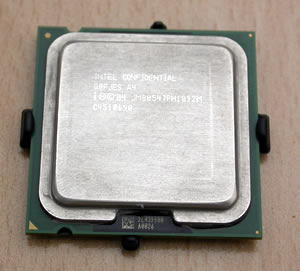
The CPU is a 775 socket, as was the Prescott series. As you can see, there are no pins on the CPU itself. Instead, these are located on the motherboard socket.

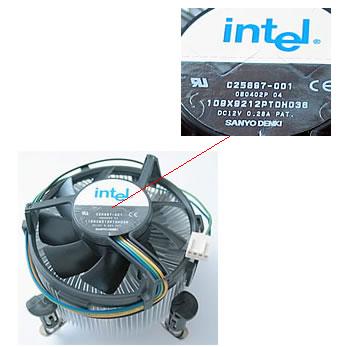
The stock cooler included in the BOX version of the P4 3.73Ghz, has nine smaller blades, same as the 660, instead of the seven bigger blades found on the 5xx series fans. The rotation speed of the fan follows the temperature, so as the heat increases, so does the fan speed making a little noise in the process.
2. Test System
Here's a rundown of our testbed used to test the Intel P4 3.73Ghz processor:
System Specifications:
CPU: Intel Pentium 4 3.73Ghz
Cooler: stock
Case: Antec
Motherboard: Asus P5AD2 E-Premium
Power supply: CoolerMaster 450W
Memory: 2X512 MBOCZ DDR2 PC2-5400 (dual channel)
VGA: AOpen Aeolus 6800Ultra PCI-E
Hard Disk Drive: WD800JD 80GB 7200RPM
OS: Windows XP Pro SP2
Drivers: 7.1.8.9
DirectX: v9.0c


Benchmarks & Applications used
- Sisoft Sandra 2005
- Prime95
- PcMark04
- 3DMark01
- 3DMark03
- 3DMark05
- PassMark Performance Test V5.0
- Half Life 2 - VST
- Asus Probe 2.23
- FlaskMPEG
- DVD Shrink
- dBPower
- WinRAR
- CPU-Z

3. SiSoft Sandra 2005
SiSoftware Sandra is a 32 and 64-bit Windows system analyser that includes benchmarking, testing and listing modules. It also provides information about the CPU, chipset, video adapter, ports, printers, sound card, memory, network, Windows internals, AGP, ODBC Connections, USB2, Firewire, etc.
The CPU Arithmetic benchmark tests how your CPU stacks up against other typical combinations:
Multi-Processor (SMP) support for up to 32/64 CPUs & SMT.
- Test takes about 20/30 seconds on P6-class PCs.
- Test is repeated 3 to 5 times to get a realistic result.
- Results outside the confidence limits (5%) are discarded.
- Command Line Switch: CPUAABench
- Requirements: None
- OS (Win32) Support: Windows 2000, XP, 2003
- OS (Win32 CE) Support: PocketPC 2000/2002/2003, SmartPhone 2002, 2003
- OS (Win64) Support: Windows XP/2003
Sandra's CPU arithmetic benchmark suite uses 2 famous benchmarks (Dhrystone and Whetstone) for stress testing the processor. Also, it includes a new version of the Whetstone test that makes use of a processor's SSE2 instructions to show the performance boost an application might gain should it be optimized for SSE2. Unfortunately, this does not always represent true real-life performance, but is useful for comparing the speed of various CPUs.

The P4 Extreme Edition seems to have no rival...
The CPU Multi-Media benchmark tests how your CPU stacks up against other typical combinations:
- Multi-Processor (SMP) support for up to 32/64 CPUs & SMT.
- Test takes about 20 seconds on P6-class PCs.
- Test is repeated 3 to 5 times to get a realistic result.
- Results outside the confidence limits (5%) are discarded.
- Command Line Switch: CPUMMBench
- Requirements: MMX (Enhanced), 3DNow! (Enhanced) or SSE(2/3) recommended
- OS (Win32) Support: Windows 2000, XP, 2003
- OS (Win64) Support: Windows XP/2003
The test has two parts:
Integer test - using integer data:
- MP SSE3 is used for better performance if supported.
- MP SSE2 is used for better performance if supported.
- MP SSE (Streaming SIMD) is used for better performance if supported.
- MP Enhanced MMX is used for better performance if supported.
- MP MMX is used for better performance if supported.
- MP ALU is used otherwise.
Floating-point test - using floating point data:
- MP SSE3 is used for better performance if supported.
- MP SSE2 is used for better performance if supported.
- MP SSE (Streaming SIMD) is used for better performance if supported.
- MP 3DNow! Enhanced is used for better performance if supported.
- MP 3DNow! is used for better performance if supported.
- MP FPU is used is used otherwise.
This test involves the generation of Mandelbrot Set fractals that are used to realistically describe and generate natural objects such as mountains or clouds. By using various multi-media extensions (MMX), 3DNow! and SSE(2/3) better performance is achieved.

In these tests, the AMD processors were left far behind. The P4 3.73Ghz ED reported much better performance than the already good Intel P4 660.
4. PCMark04
PCMark04 is an application-based benchmark and a premium tool for measuring overall PC performance. It uses portions of real applications instead of including very large applications or using specifically created code. This allows PCMark04 to be a smaller installation as well as to report very accurate results. As far as possible, PCMark04 uses public domain applications whose source code can be freely examined by any user.
PCMark04 includes 4 categorized suites for benchmarking your computer. These include CPU, Graphics, Memory and a Hard Disk Drive benchmark. In our case, we selected only the CPU test suite.

With PCMark04, the P4 3.73Ghz ED achieved the highest score from among the CPUs we have included in the test.
The test results, more analytically:
| |
Intel P4 3.73Ghz |
Intel P4 660 |
AMD 3800+ |
| File Compression (MB/sec) |
5.4 |
5.3 |
3.3 |
| File Encryption (MB/sec) |
70.5 |
65.6 |
37.2 |
| File Uncompression (MB/sec) |
45.2 |
42.9 |
28.9 |
| Image Processing (MPixels/sec) |
18.5 |
16.9 |
14.6 |
| Grammar Check (KB/sec) |
3.0 |
2.4 |
6.5 |
| File Decryption (MB/sec) |
107.5 |
102.3 |
74.2 |
| Audio Conversion (KB/sec) |
2921.7 |
2779.1 |
3171.9 |
| WMV Video Compression (FPS) |
64.1 |
59.7 |
56.2 |
| DivX Video Compression (FPS) |
88.4 |
77.6 |
71.8 |
The AMD 3800+ is still better in the Grammar Check and Audio Conversion, by a distance from the next best. In all other tests, Intel's products lead.
5. 3DMark01
3DMark2001 SE is a diagnostics tool for measuring the 3D game performance of PCs. It is entertaining and easy to use, which makes it "must have" software for all home PC users interested in 3D games. Even a beginner PC user can get a game performance measurement with 3DMark2001 SE.
Although the 3DMark series is more dedicated to 3D graphics performance, it is rather interesting to see how a faster CPU helps the VGA system achieve higher FPS.
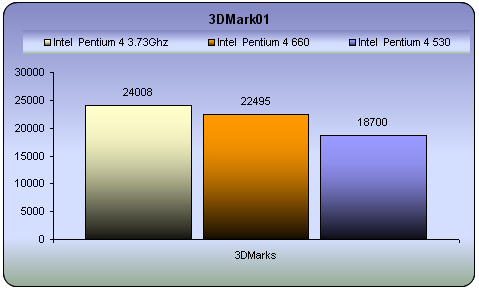
The scores speak for themselves.
6. 3DMark03
3DMark is a widely used and accepted benchmark that stresses the DirectX performance of a VGA card. For testing the performance of each card we use the 4 game benchmark 3DMark offers. The first is a DirectX 7 game, the second and the third use DirectX 8 and the last one stresses graphics in DirectX 9. A very strong point of 3DMark is that its VGA card measuring does not require a lot of CPU power. So the resulting fps are a good reference of a VGA card's rendering performance.
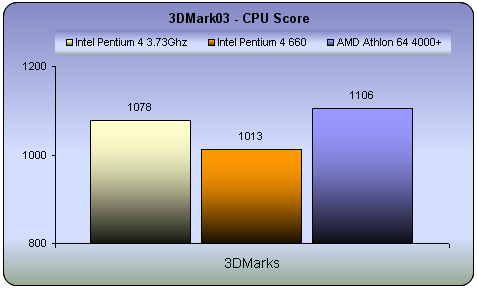
A marked improvement for the P4 3.7GHz over the P4 660, but not as good as the AMD processor.
7. 3DMark05
3DMark05 is concentrated on measuring the performance of the DirectX 9 generation of 3D hardware using the technology of next generation games. Earlier 3DMark versions have usually been launched with the introduction of a new Microsoft DirectX version and with the introduction of a new hardware generation. This has somewhat limited how much 3DMark has utilized the new hardware features. At the time of this writing, DirectX 9 was introduced soon two years ago, and there is now DX9 generation hardware available all the way from the very high end to value and mobile parts. 3DMark05 can thereby utilize the features of DirectX 9 to a 100%. In fact, DirectX 9 hardware is required for every game test of 3DMark05, resulting in the ultimate tool for DirectX 9 hardware performance comparison.
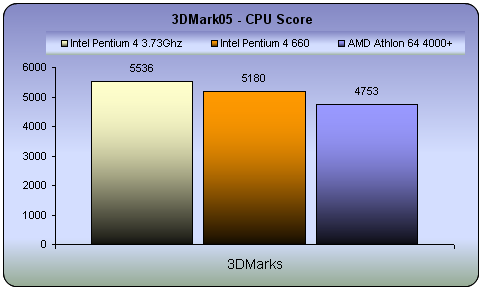
In our previous review, we had described how much better the performance of the P4 660 was in comparison to the AMD 4000+ in this test. From the graph above, you can see that the P4 3.73Ghz ED is even better.
8. PassMark
CPU Benchmarks
The suite of PassMark Performance Tests contains multi-process CPU tests such as:
- Integer (32-bit addition, subtraction, multiplication and division)
- Floating Point (32-bit addition, subtraction, multiplication and division)
- WIN32: MMX (matrix multiplication) or WIN64: 64bit Integer Matrix Multiplication
- WIN32: SSE (128-bit SSE operations such as addition, subtraction and multiplication) or WIN64: 64bit Floating Point Matrix operations
- WIN32: 3Dnow! (3D transformation of an array of 32-bit vertices) or WIN64: 64bit Floating Point Matrix operations
- Compression
- Encryption
- Image Rotation (Rotate image co-ordinates in memory)
- Random String Sorting
Integers are whole numbers such as 23, 459532, -26. Floating point numbers contain a fractional part, e.g. 1.003, 98394.2. These two types of numbers are treated quite differently inside a computer, which is why PerformanceTest differentiates between the two.
For each of the integer tests, a large array of random 32 bit integers is processed using the particular mathematical operations listed below. For the floating point tests, single precision floating point numbers (32 bit) are used.
The "PassMark rating" is a weighted average of all the other test results and gives a single overall indication of the computers performance. The bigger the number, the faster the computer. The "PassMark rating" can only be calculated if the results from all other tests are available. The value is calculated as follows.
| Test Suite |
Weighting |
| Disk |
20% |
| CD / DVD |
9% |
| Memory |
18% |
| 3D Graphics |
12% |
| 2D Graphics |
14% |
| CPU |
27% |
| Total |
100% |
In our case however, we only ran the suite for the CPU.
First, we chose "All" the tests for the CPU, as described above. The following results are for the Intel P4 3.73Ghz ED:
Below you can see the difference between the 3.73Ghz ED and the 660.
As was expected, in all cases the P4 3.73Ghz ED was better.
Multitasking Benchmarks
The Advanced Multi Process Test of the PassMark benchmark is designed to run a series of standard benchmark tests in parallel, to examine the performance under these conditions. Multiple processor machines should excel under this kind of environment, as the load is split between the various CPUs.
The tests include a number of the standard PassMark benchmarks along with some popular benchmarking algorithms and tests which emulate some day-to-day operations your CPU may be required to carry out which are particularly processor heavy.
As the tests are quite varied, as are their results, it unfortunately means that no graphing feature exists as is common amongst the other Advanced Tests. However, it is still possible to export the various results to HTML as usual.
| Test Name |
Intel 3.73 |
Intel 660 |
Primes found |
| Prime Number Search |
51341 |
57306 |
Primes Found |
| Sorting Random Strings |
153388 |
84490 |
Thousand strings sorted per second |
| Compression |
264 |
331 |
KBytes per second |
| Encryption |
1409.74 |
831.61 |
KBytes per second |
| Rotation |
22.78 |
27.92 |
Rotation per second |
| MMX Addition |
49.87 |
40.87 |
Million Ops/Sec |
| MMX Multiplication |
46.91 |
99.25 |
Million Ops/Sec |
| Integer addition |
75.35 |
44.84 |
Million Ops/Sec |
| Whetstone |
226.07 |
300.50 |
Million Ops/Sec |
| Dhrystone |
254.73 |
159.92 |
Million Ops/Sec |
| Memory Read |
289.39 |
276.58 |
MB/sec |
| Memory Write |
289.33 |
276.59 |
MB/sec |
| Disk Access |
0.15 |
0.73 |
MB/sec |
Generally, the P4 3.73Ghz ED was faster, but there are some cases where the P4 660 performed better.
More details about each test below:
The Tests
- Prime Number Search:
This test uses a simple brute force prime number finding algorithm. It begins at 3 and checks every integer to see if it is a member of the set of primes. (A prime number is one which is divisible only by 1 and itself). The test reports the amount of primes found and the largest prime. Note that for longer test periods, the rate of Primes Per Second found will drop as the distance between primes gets larger.
- Sorting Random Strings:
The test uses qsort to continually sort 1000 strings of 256 characters. Once the test duration expires, the test reports the speed of the sorting in thousands of strings per second.
- Compression:
The Compression test uses an Adaptive encoding algorithm based on source code from Ian H. Witten, Radford M. Neal, and John G. Cleary in an article called “Arithmetic Coding for Data Compression”. The system uses a model which maintains the probability of each symbol being the next encoded. It reports a compression rate of 363% for English text, which is slightly better than the Huffman method. This test reports its results in KBytes/Sec compressed.
- Encryption:
The encryption test uses the Blowfish enciphering algorithm. It is based on the C implementation by Paul Kocher. Data is enciphered using a 16byte key in blocks of 4 KB. The test reports in KBytes/Sec.
- Rotation:
The rotation algorithm is a PassMark developed algorithm using standard rotation mathematics. The test uses a 400 x 400 pseudo image with one byte of data per pixel. The image is rotated degree by degree, with each degree counting as one rotation. The test reports in rotations per second.
- MMX Addition:
- MMX Multiplication:
These are the standard PassMark benchmarks. See MMX Tests for more information. These tests are only included with the version of PT that is for the 32-bit version of Windows.
- Maths Integer addition:
This is a standard PassMark benchmark. See Maths Tests for more information.
- Whetstone:
The Whetstone benchmark is one commonly used to test floating point arithmetic. The algorithm is based on the original C source code written by Rich Painter. The benchmark is designed to test the speed of commonly used floating point CPU instructions. The test reports in MIPS (Million Instructions Per Second.)
- Dhrystone:
The Dhrystone benchmark is one commonly used to test a machines integer arithmetic. The algorithm is based on the C source code for Dhrystone version 2 by Reinhold P. Weicker. The test reports in MIPS.
- Memory Read:
- Memory Write:
These are the standard PassMark benchmarks. See Memory Tests for more information.
- Disk Access:
This test uses the same test engine as the PassMark Advanced Disk Test. The test uses a file size of the current available RAM, a block size of 4K, the Win32 uncached interface, a 50%/50% RW level, it is 100% Sequential and executed in Synchronous mode. The test reports its results in MB/Sec.
9. Prime95
Prime95 is basically a Mersenne prime number discovery program. It's a great example of Distributed Computing, but it's most loved by overclockers for its powerful system stress-testing and benchmarking abilities. It can torture-test your CPU to produce its maximum heat or spit out any errors due to excessive overclocking. Also, using the blend test, it can consume all your physical memory and run error-checking tests on your modules to ensure their quality. However, right now, we're mostly interested in it for its benchmarking capabilities.
Here are the times for the Intel Pentium 4 3.73Ghz ED and 660, AMD Athlon 64 FX-55 and 3800+ (less is better).
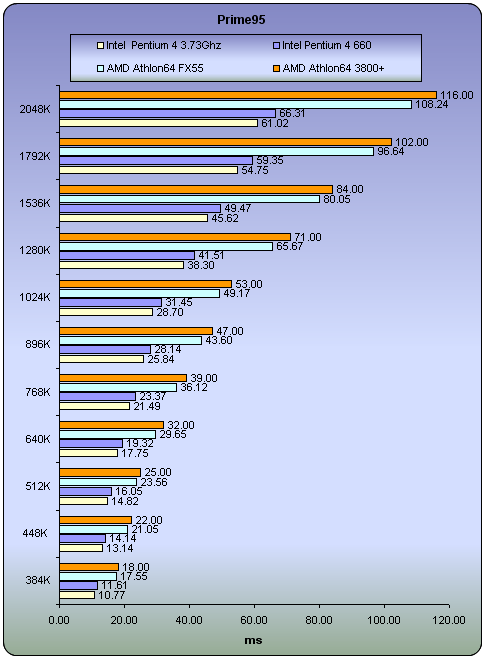
As we mentioned in our previous review, AMD processors are known for their weakness in this test.
10. Encoding
Benchmarks are good for reference and comparison, but what about real life performance? For this reason, we did some simple tests using popular utilities that most users use every day.
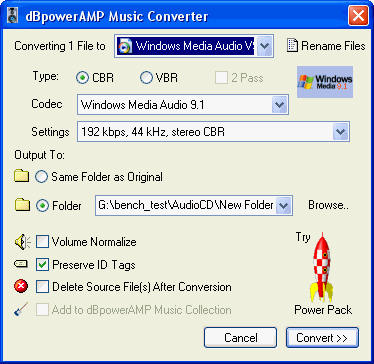
dBPower Tests
In the following graph, you can see how the three different CPUs performed while encoding the same audio file into different formats. For this we used a whole music CD of size 750MB. We ripped the AudioCD using EAC and then with dBPower, we encoded from one format to another. The times needed for each task are given below ( the lower the better off course :-).
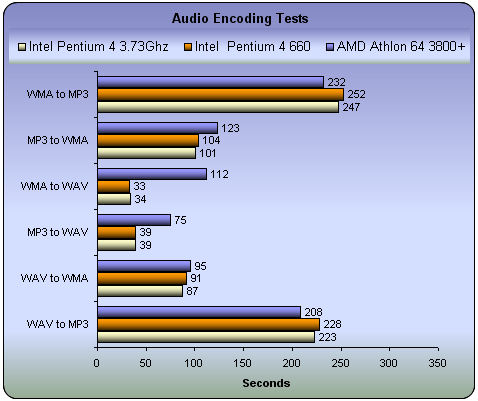
The AMD 3800+ maintains its supremacy with WMA to MP3 and WAV to MP3 conversions. In all other tasks, the Intel CPUs were better.
The settings for dBPower were the same for all CPUs. Analytically:

DVD Shrink Tests
Compressing a movie from DVD9 to DVD5 is a very common task. For this reason we ripped an original movie (which we own off course :-), using DVD Decrypter. Then, with DVD Shrink we compressed it in order to fit it onto a DVD5 disc. The size of the original movie was 6.85GB and we made it 4.463GB. Below you can see how many frames per second each CPU can process and the total time needed for the encoding.
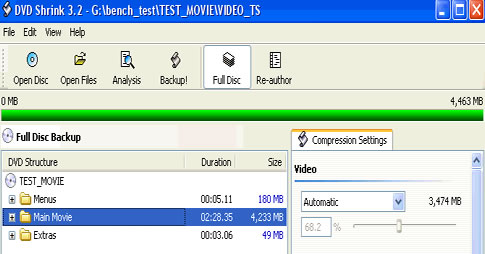
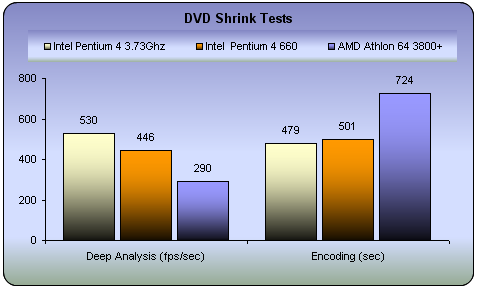
Excellent performance! Even more fps while less time was needed for the video conversion task.
DivX Tests
Another very common task is to convert a movie into DivX format. For this we used a .vob file, sized 202MB which with FlaskMPEG was converted to .avi. The settings for this are given below:
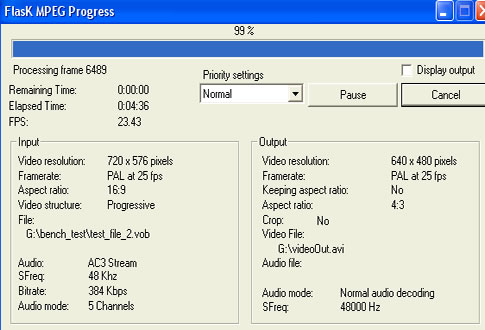

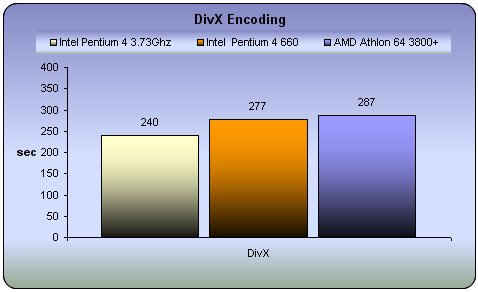
The difference of 37sec and 47sec between the P4 3.7 and the P4 660 and AMD 3800+, is significant since as we mentioned previously, the processed video file is only 202Mb.
WinRAR Tests
Using a folder with 101MB of various data, we checked how much time each of the CPUs under test needed to compress and extract the data.

When compressing, the AMD is still faster but quite a bit slower when uncompressing...
11. Half Life 2 - VST
Half life 2 is no doubt the most anticipated pc game of all times. Gamers having the excellence of Half Life 1 in mind, as well as the remarkable E3 demo preview, have been anxiously waiting for the much delayed release of HL2.
 Physics - From pebbles to water to 2-ton trucks respond as expected, as they obey the laws of mass, friction, gravity, and buoyancy.
Graphics - Source's shader-based renderer, like the one used at Pixar to create movies such as Toy Story® and Monster's, Inc.®, creates the most beautiful and realistic environments ever seen in a video game.
AI - Neither friends nor enemies charge blindly into the fray. They can assess threats, navigate tricky terrain, and fashion weapons from whatever is at hand.
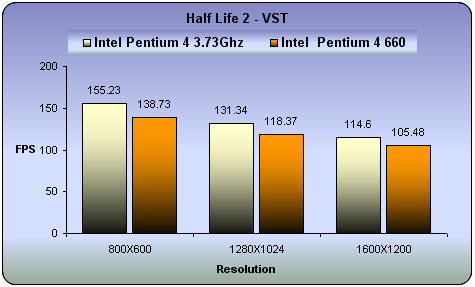
The P4 3.73Ghz ED reported even better performance with games. The above difference in performance can be considered as anything but negligible.
12. Overclocking
In order to overclock the CPU, we manually started step by step to increase the FSB, beginning from the default 266. Finally, we found that the system was running properly only up to 4.27Ghz. Higher speeds had as a result, the famous blue screens.

Overclocking forced the memory to run from 711Mhz and 4-4-4-7 timings to 460Mhz and 5-5-5-15.

At 4.27Ghz and idle state, the CPU temperature was close to 52°C. FYI, the P4 660 when overclocked at 4.00Ghz had a temperature of 44°C.

- The Tests
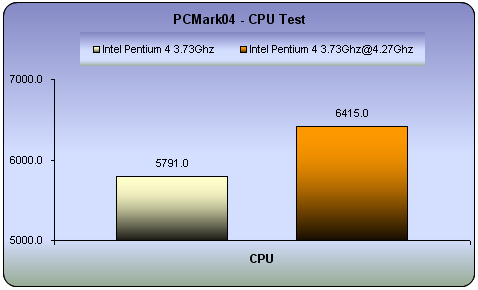
Although the overclocked speed is not too high, the reported results are quite different. The already fast P4 3.73Ghz ED CPU becomes even faster.
| SiSoft Sandra 2005 Arithmetic Benchmark |
| 3.73Ghz |
 |
| 4.27Ghz |
 |
| SiSoft Sandra 2005 Multimedia Benchmark |
| 3.73Ghz |
 |
| 4.27Ghz |
 |
The performance in SiSoft Sandra is also much better when we set the FSB form 266 to 305.
13. Conclusion
 If you remember, in our previous review on the Intel P6 660, we had mentioned that the Pentium 4 660 is at the top of Intel's 64-bit family line, if we don't consider the existence of the Extreme Edition series at 3.73Ghz. Well, now is the time for the Extreme Edition Pentium at 3.73Ghz to make its mark.
The P4 at 3.73Ghz, reported excellent performance in all of our tests. The 660 was very good, but the P4 ED is even better. Any type of conversion process was such a simple matter with the Extreme Edition P4. And where game performance with the Intel 660 was very good, the new P4 ED CPU increased the frame rates even more. It seems that having the FSB at 1066Mhz helps this. It is worth mentioning that the P4 ED achieved a score of 5791.0 in PCMark04 and 5536.0 in the CPU test of 3DMark05 when the P4 660 had 5431.0 and 5180.0 and the AMD 4000+ 4521.0 and 4753.0 for the same tests.
However, for all these good things there is a small price to pay and I'm not referring to the price, which we will discuss shortly. The temperature of the P4 ED CPU is very high, even in idle state, close to 50 °C and the power consumption more than any of the other CPUs in the Intel series (i.e. the 5xx and 6xx).
The price for Pentium 4 3.73Ghz Extreme Edition retail package is close to US$1050. If we set aside the high price for now, the performance of this CPU was great, as we have already mentioned. But we are curious to see how this can compare with the Pentium 4 670 at 3.8Ghz, which is at least US$150 cheaper, or even better, with the new AMD 4800+ Dual Core that costs about the same money.
We hope soon, to be able to satisfy our curiosity on this. Stay tuned...