1. Introduction
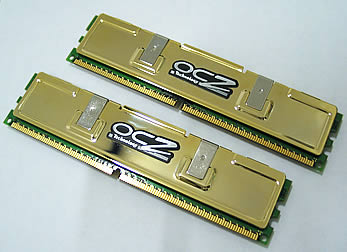
 is a well known company, producing quality memory for almost all lines of PC users, for home, business, professional as well as enthusiast overclockers. Recently, OCZ provided us with its latest DDR2 PC2-5400 Gold Dual Channel modules.
- Memory Description & Specs
OCZ Gold DDR2 is designed to offer gamers incredible high speed performance at a relatively low price. The OCZ PC2-5400 Gold Series boasts 4-4-4 timings - lower latencies than standard DDR2-677 - combating system lag time and helping deliver maximum frame rates.
All OCZ Gold DDR2 products are 100% hand-tested to ensure reliable performance. Furthermore, every DDR2-677 Dual Channel Kit is confirmed as a matched pair to ensure flawless performance on most motherboards. Each member of the OCZ PC2-5400 Gold family offers integrated gold mirrored copper heatspreaders for efficient heat dissipation, a lifetime warranty, toll-free technical support and the exclusive EVP® (Extended Voltage Protection) coverage.
Manufactured to OCZ's rigid standards for quality and performance, the OCZ Gold DDR2 is the ultimate gaming solution and a must-have for a mission complete.
Specifications:
- 667MHz DDR2
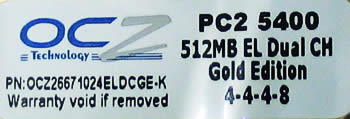
- CL 4-4-4-8 (CAS-TRCD-TRP-TRAS)
- 1GB (2X512) and 2GB (2X1024) dual channel optimized kits
- Unbuffered
- Gold Mirrored Copper Heatspreader
- Lifetime Warranty
- 1.8 Volts
- 240 Pin DIMM
- 2.2V EVP - OCZ's unique Extended Voltage Protection feature allows PC2-5400 modules to handle voltages up to 2.2V ±5% and still be covered by our Lifetime Warranty.

The label on the 512MB modules we received :
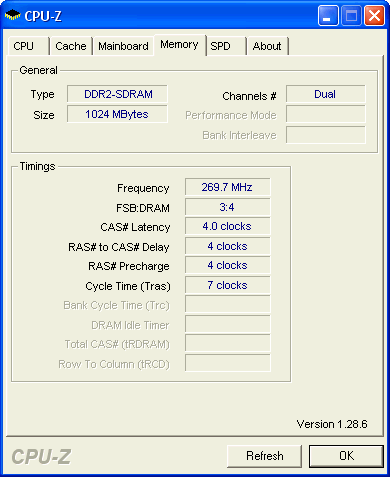
In the following pages we will compare the performance of the OCZ PC2 5400 Gold Series at three different settings. First, we will set the CPU at FSB800, the memory at 533Mhz and the voltage at minimum 1.8V. Next, we will increase the voltage for the memory modules to the maximum allowed, 2.2V. Finally we will set the FSB speed to 1066 and the memory modules to 667Mhz.
2. Test System
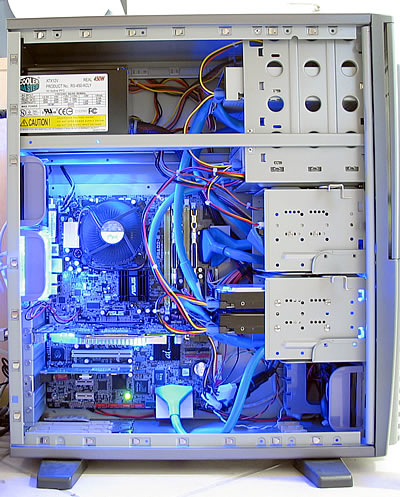
Here's a rundown of our testbed:
System Specifications
CPU: Intel Pentium 4 530
Cooler: stock
Case: Antec
Motherboard: Asus P5AD2E-Deluxe
Power supply: CoolerMaster 450W
Memory: 2X512 MBOCZ DDR2 PC5400 (dual channel)
VGA: AOpen Aelus N6800Ultra PCIe
Hard Disk Drive: WD800JD 80GB 7200RPM
OS: Windows XP Pro SP2
Drivers: 7.1.8.4
DirectX: v9.0c
The default setting of our PC during the tests was as following:

We increased the FSB and memory speed:

The CPU speed increased from 3.0Ghz to 3.75Ghz and the memory timings changed from 4-4-4-8 to 5-5-5-15.

We choose those settings because our Asus motherboard had the 1000/667 option in its overclocking profiles.
Benchmarks & Applications used
- Sisoft Sandra 2005
- PcMark04
- PassMark Performance Test V5.0
- Half Life 2 - VST
- CPU-Z

3. SiSoft Sandra 2005
 SiSoftware Sandra is a 32-bit and 64-bit Windows system analyser that includes benchmarking, testing and listing modules. It tries to go beyond other utilities to show you more of what is really going on under the hood so you can draw comparisons at both a high and low-level in a single product.
You can see information about the CPU, chipsets, video adapter, ports, printers, sound card, memory, network, Windows internals, AGP, ODBC Connections, USB2, Firewire etc.
You can save/print/fax/e-mail/post/upload or insert into ADO/ODBC databases reports in text, HTML, XML, SMS/DMI or RPT format.
This version supports multiple sources of information gathering including: remote computers, PDAs, Smart Phones, ADO/ODBC databases or saved system reports.
All benchmarks are optimised for both SMP & SMT (Hyper-Threading), up to 32/64 CPUs depending on the platform.
Memory Bandwidth Benchmark
Tests how your memory sub-system compares to other systems with the same or similar memory in other systems. The benchmark is based on the well-known STREAM memory bandwidth benchmark.
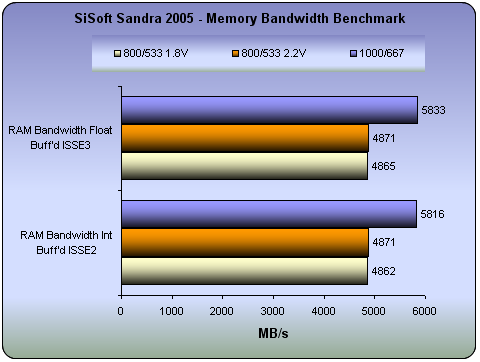
The increased voltage from 1.8V to 2.2V seems to have had a negligible affect on memory performance. On the other hand, when we set our system to 1000FSB/667Mhz the performance increased substantially.
Cache & Memory Benchmark
Tests how your CPU cache and memory sub-system(s) compares to other systems with the same or similar CPU & memory. The benchmark is based on the Memory Bandwidth Benchmark test.
Combined Index: is a composite figure representing the overall performance rating of the entire Cache-Memory performance in terms of MB/s. The value is the logarithmic average of all the results for the entire address space. (Higher is better, i.e. better performance)
For block sizes that could not been tested - the average of previous blocks is used, thus the size of the memory (as long as it is not comparable to largest cache size) is not significant; all cache sizes are significant - larger caches will result in a higher index.
Speed Factor: is a figure representing the speed differential between the CPU’s cache and memory. The value is the ratio of the fastest cache (i.e. L1) bandwidth to the main memory bandwidth. (Lower is better, i.e. the memory is not very much slower than CPU’s cache)
As the factor is a ratio, it is useful only in comparing different CPUs and memory sub-systems rather than having a direct, physical interpretation associated to its numerical value.

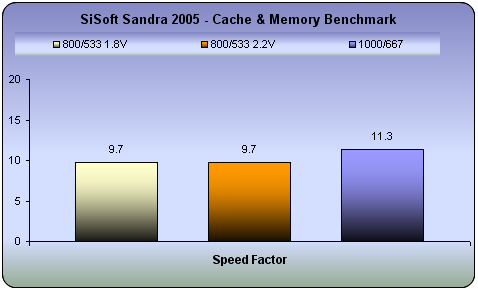
Great performance at 1000/667. However, even at the normal setting the performance was good.
4. PCMark04
 PCMark04 is an application-based benchmark and a premium tool for measuring overall PC performance. It uses portions of real applications instead of including very large applications or using specifically created code. This allows PCMark04 to be a smaller installation as well as to report very accurate results. As far as possible, PCMark04 uses public domain applications whose source code can be freely examined by any user.
PCMark04 includes 4 categorized suites for benchmarking your computer. These include CPU, Graphics, Memory and a Hard Disk Drive benchmark. In our case, we select only the Memory test suite.

| PCMark04 Memory Test |
| |
800/533 1.8V (MB/s) |
800/533 2.2V (MB/s) |
1000/667 (MB/s) |
| Raw Block Read - 8 MB |
6030.2 |
6067.4 |
7384.6 |
| Raw Block Read - 4 MB |
6319.6 |
6367.6 |
7738.0 |
| Raw Block Read - 192 KB |
23764.5 |
23813.1 |
29522.7 |
| Raw Block Read - 4 KB |
39964.7 |
40196.6 |
49422.8 |
| Raw Block Write - 8 MB |
4075.5 |
4092.8 |
5066.0 |
| Raw Block Write - 4 MB |
4076.0 |
4093.6 |
5067.1 |
| Raw Block Write - 192 KB |
10195.1 |
10240.0 |
12684.0 |
| Raw Block Write - 4 KB |
10227.7 |
10218.9 |
12721.4 |
| Raw Block Copy - 8 MB |
2104.5 |
2161.4 |
2520.9 |
| Raw Block Copy - 4 MB |
2345.7 |
2377.7 |
2741.6 |
| Raw Block Copy - 192 KB |
7989.1 |
8021.7 |
9936.1 |
| Raw Block Copy - 4 KB |
10232.1 |
10277.4 |
12723.0 |
| Random Access - 8 MB |
3492.8 |
3540.8 |
4239.8 |
| Random Access - 4 MB |
3531.3 |
3546.5 |
4220.1 |
| Random Access - 192 KB |
6343.8 |
6342.0 |
7380.3 |
| Random Access - 4 KB |
10173.0 |
10211.8 |
12642.2 |
The increased voltage increased the memory speeds in all tests. When set to 1000/667, the system took off!
5. PassMark
 Passmark PerformanceTest is an award winning PC hardware benchmark utility that allows everybody to quickly assess the performance of their computer and compare it to a number of standard 'baseline' computer systems.
Twenty seven standard benchmark tests are available in seven test suites plus there are five advanced testing windows for custom benchmarking. CPU Tests, 2D Graphics Tests, 3D Graphics Tests, Disk Tests, Memory Tests and CD/DVD Tests. In our case we selected the Memory suite Tests.
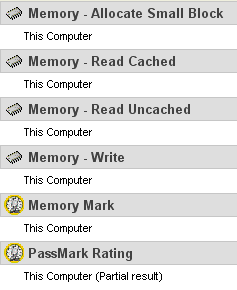
- Memory Benchmarks
This suite contains a number of tests that exercise the memory sub-system of the computer. (Random Access Memory- RAM)
Memory - Allocate small block
This test measures the time taken to allocate & free small zeroed memory blocks (around 100KB block size)
Memory - Cached
This test measures the time taken to read a small block of memory. The block is small enough to be held entirely in cache (if one is present)
Memory - UnCached
This test measures the time taken to read a large block of memory. The block is too large to be held in cache.
Memory - Write
This test measures the time taken to write information into memory.
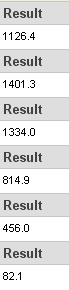
| |
800/533 1.8V |
800/533 2.2V |
1000/667 |
 |
 |
 |
 |
Similar performance between the different voltages. Some negligible difference is logical. As it was expected the overclocking profile boost the performance a lot.
- Advanced Memory Benchmarks
Memory Speed Per Access Step Size
The first test type, ‘Memory Speed Per Access Step Size’ accesses a large block of memory in various sized steps. First, it runs through the block of memory sequentially, accessing every value. Next it runs through the same block again, except this time it accesses every second value. On this occasion, it runs through the block twice in order to access the same amount of data as the initial step. Next it runs through the same block again, except this time it accesses every fourth value and so makes four passes. And so on, until a certain maximum step size is reached.
The size of the block of memory used for this test is one quarter the amount of system RAM. The size of the steps varies from 1 (continuous sequential access), to one quarter the size of the block of memory (i.e. one sixteenth of system RAM ).
 |
 |
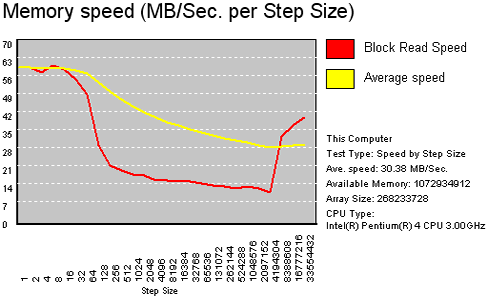
Memory Speed Per Access Step Size |
The memory speed exhibited a great difference between the default and the overclocked profile.
Vertical axis (Y axis)
The vertical axis displays a variable scale. Low values at the bottom, high values at the top. Depending on the graph type, this scale will be measured in Megabytes / Sec or Megabits / sec.
Horizontal axis (X axis)
The horizontal axis typically shows either a time period or a number of categories (such as block size) depending on the test selected. Note that 1000 Milliseconds = 1 Second.
Instantaneous result
This is indicated by a red line. This line shows the result that was measured between two samples. Typically, 100 samples are taken during the tests to produce the graphs.
Average result
This is indicated by a yellow line. This line shows the average result taken from the start of the test. In general, the average speed gives a better indication of performance than the instantaneous speed.
 |
 |
Memory Speed Per Block Size |
Once again, the performance with the overclocked profile shows a marked increase.
Memory Speed Per Block Size
When a computer program wants to use a section of memory to store data, it makes a request to Windows for the amount of memory it requires. Windows allocates the memory to the program ( unless system resources are very low ) and returns to the requesting program the address of the first memory slot in the allocated block. It is possible that some programs may request very large amounts of memory. The ‘Memory Speed Per Block Size’ test like the ‘Memory Speed Per Access Step Size’ test, is composed of many steps. During each step of the test, PerformanceTest requests a block of memory and runs through the block measuring the average access time. However, on each subsequent step, the size of the requested memory is increased, until finally a block close to the size of the system RAM is requested. In this way, it is possible to observe the different access speeds for the different sizes of blocks.
Typically, it is possible to see very fast memory access for blocks which are small enough to fit entirely into the L2 RAM cache, and slower access times for larger blocks accessed from main RAM. In the case where system resources are low, swapping to the disk may even be required for very large blocks.
Access data type
One byte is the smallest amount possible, which can be read from or written to memory. As the test runs through each block, the user can also select whether we access the memory one byte at a time, two bytes at a time, or four bytes at a time.
6. Half Life 2 - VST
 Half life 2 is no doubt the most anticipated pc game of all times. Gamers having the excellence of Half Life 1 in mind, as well as the remarkable E3 demo preview, have been anxiously waiting for the much delayed release of HL2.
Physics - From pebbles to water to 2-ton trucks respond as expected, as they obey the laws of mass, friction, gravity, and buoyancy.

Graphics - Source's shader-based renderer, like the one used at Pixar to create movies such as Toy Story® and Monster's, Inc.®, creates the most beautiful and realistic environments ever seen in a video game.
AI - Neither friends nor enemies charge blindly into the fray. They can assess threats, navigate tricky terrain, and fashion weapons from whatever is at hand.

In games, the voltage increase won't make a lot of difference but the FSB and memory speed will.
7. Conclusion
After completing our review, we received from Intel its Extreme Edition 3.73Ghz CPU.
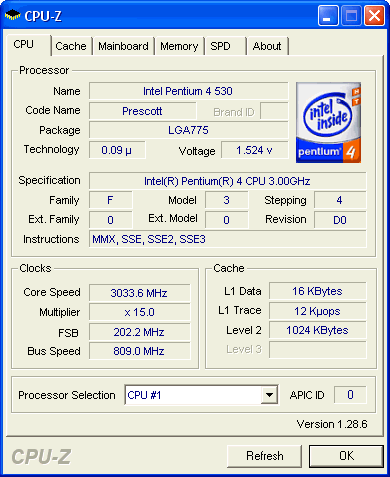
Check what CPU-Z reported:

We set the memory at 711Mhz!!!

8. Update 1
After completing our review, we received from Intel its Extreme Edition 3.73Ghz CPU.
Check what CPU-Z reported:
We set the memory to 711Mhz!!!
9. Update 2
We repeated most of the tests in order to find the speed limit for the OCZ PC2-5400, using once again our Pentium 4 530 3.00GHz system.
The maximum overclocking speed we managed with our CPU was 3.93GHz with the memory running at 698MHz. Its stability was confirmed with Memtest86+. The memory couldn't go any higher as at 701MHz, Memtest86+ reported errors. We then tried to increase the timings from 4-4-4-8 to 5-5-5-15 but there was no change. The voltage for the modules was set at 2.2V in all cases.


We then repeated some of the benchmarks in order to find out the difference in performance.
The PCMark04 score increased from 6148.0 to 6571.0.
| PCMark04 Memory Test |
1000/667
(MB/s) |
1050/698
(MB/s) |
| Raw Block Read - 8 MB |
7384.6 |
7867.9 |
| Raw Block Read - 4 MB |
7738.0 |
8182.1 |
| Raw Block Read - 192 KB |
29522.7 |
30924.3 |
| Raw Block Read - 4 KB |
49422.8 |
51953.7 |
| Raw Block Write - 8 MB |
5066.0 |
5299.3 |
| Raw Block Write - 4 MB |
5067.1 |
5299.5 |
| Raw Block Write - 192 KB |
12684.0 |
13261.0 |
| Raw Block Write - 4 KB |
12721.4 |
13298.0 |
| Raw Block Copy - 8 MB |
2520.9 |
2827.9 |
| Raw Block Copy - 4 MB |
2741.6 |
3130.3 |
| Raw Block Copy - 192 KB |
9936.1 |
10379.4 |
| Raw Block Copy - 4 KB |
12723.0 |
13289.6 |
| Random Access - 8 MB |
4239.8 |
4591.1 |
| Random Access - 4 MB |
4220.1 |
4590.9 |
| Random Access - 192 KB |
7380.3 |
7640.7 |
| Random Access - 4 KB |
12642.2 |
13229.9 |
While with Sisoft Sandra 2005, the results changed as follows:
| 1000/667 |
1050/698 |
| 5816 |
 |
| 5833 |
| 10665 |
 |
| 11.3 |
Finally, the framerate in Half Life 2 was raised from 134.05 to 143.5 fps. While the memory is not directly responsible for this, the higher overclocking speed attained with the CPU is, which is in turn related to the memory.
Excellent and stable performance...